Convert column Values to Columns in a Pandas DataFrame
Last updated: Apr 12, 2024
Reading time·5 min

# Table of Contents
- Convert column Values to Columns in a Pandas DataFrame
- Convert column Values to Columns in a Pandas DataFrame using pivot
- Convert column Values to Columns in a Pandas DataFrame using groupby() and unstack()
# Convert column Values to Columns in a Pandas DataFrame
Use the DataFrame.pivot_table() method to convert column values to columns
in a Pandas DataFrame.
The method will return a spreadsheet-style pivot table as a DataFrame.
import pandas as pd df = pd.DataFrame({ 'Frontend': ['React', 'Vue', 'Angular'], 'Styles': ['Bootstrap', 'Vuetify', 'Material'], }) print(df) print('-' * 50) df2 = df.pivot_table(values='Styles', index=df.index, columns='Frontend', aggfunc='first') print(df2)
Running the code sample produces the following output.
Frontend Styles 0 React Bootstrap 1 Vue Vuetify 2 Angular Material -------------------------------------------------- Frontend Angular React Vue 0 NaN Bootstrap NaN 1 NaN NaN Vuetify 2 Material NaN NaN
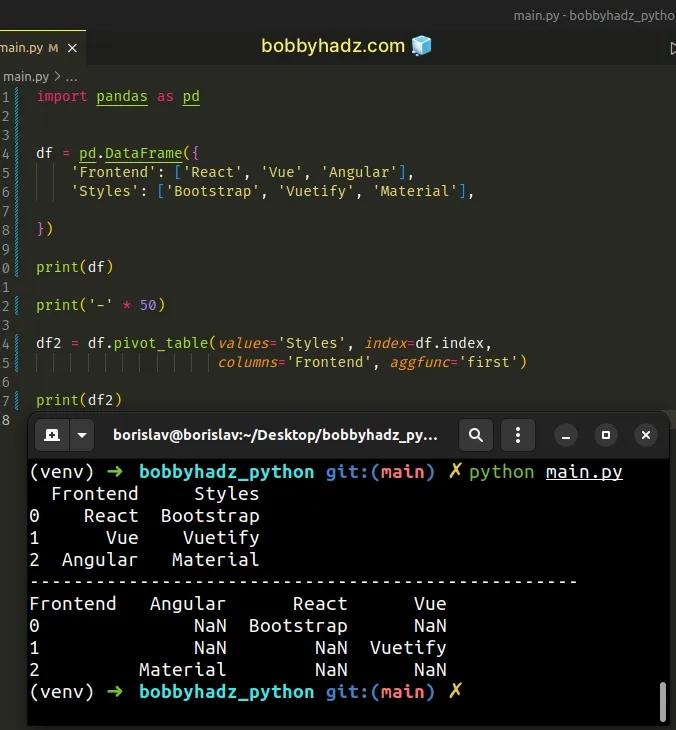
We passed the following arguments to the DataFrame.pivot_table method:
values- the column (or multiple columns in a list) to aggregate.index- the index column.- columns - the column values that you want to use as column headers.
aggfunc- the aggregation function.
# Convert column Values to Columns in a Pandas DataFrame using pivot
You can also use the
DataFrame.pivot()
method to convert the column values of a DataFrame to columns.
import pandas as pd df = pd.DataFrame({ 'id': [1, 2, 3], 'Frontend': ['React', 'Vue', 'Angular'], 'Styles': ['Bootstrap', 'Vuetify', 'Material'], }) print(df) print('-' * 50) df2 = df.pivot(index='id', columns='Frontend', values='Styles') print(df2)
Running the code sample produces the following output.
id Frontend Styles 0 1 React Bootstrap 1 2 Vue Vuetify 2 3 Angular Material -------------------------------------------------- Frontend Angular React Vue id 1 NaN Bootstrap NaN 2 NaN NaN Vuetify 3 Material NaN NaN

The DataFrame.pivot method returns a reshaped DataFrame that is organized by
the given index/column values.
We could've also accessed the Styles column using bracket notation instead of
supplying the values argument.
import pandas as pd df = pd.DataFrame({ 'id': [1, 2, 3], 'Frontend': ['React', 'Vue', 'Angular'], 'Styles': ['Bootstrap', 'Vuetify', 'Material'], }) print(df) print('-' * 50) df2 = df.pivot(index='id', columns='Frontend')['Styles'] print(df2)
Running the code sample produces the following output.
id Frontend Styles 0 1 React Bootstrap 1 2 Vue Vuetify 2 3 Angular Material -------------------------------------------------- Frontend Angular React Vue id 1 NaN Bootstrap NaN 2 NaN NaN Vuetify 3 Material NaN NaN
# Convert column Values to Columns in a Pandas DataFrame using groupby() and unstack()
You can also use the groupby() and unstack() methods to convert the column
values in a DataFrame to columns.
import pandas as pd df = pd.DataFrame({ 'id': [1, 2, 3], 'Frontend': ['React', 'Vue', 'Angular'], 'Styles': ['Bootstrap', 'Vuetify', 'Material'], }) print(df) print('-' * 50) df2 = df.reset_index().groupby(['id', 'Frontend'])[ 'Styles'].aggregate('first').unstack() print(df2)
Running the code sample produces the following output.
id Frontend Styles 0 1 React Bootstrap 1 2 Vue Vuetify 2 3 Angular Material -------------------------------------------------- Frontend Angular React Vue id 1 NaN Bootstrap NaN 2 NaN NaN Vuetify 3 Material NaN NaN
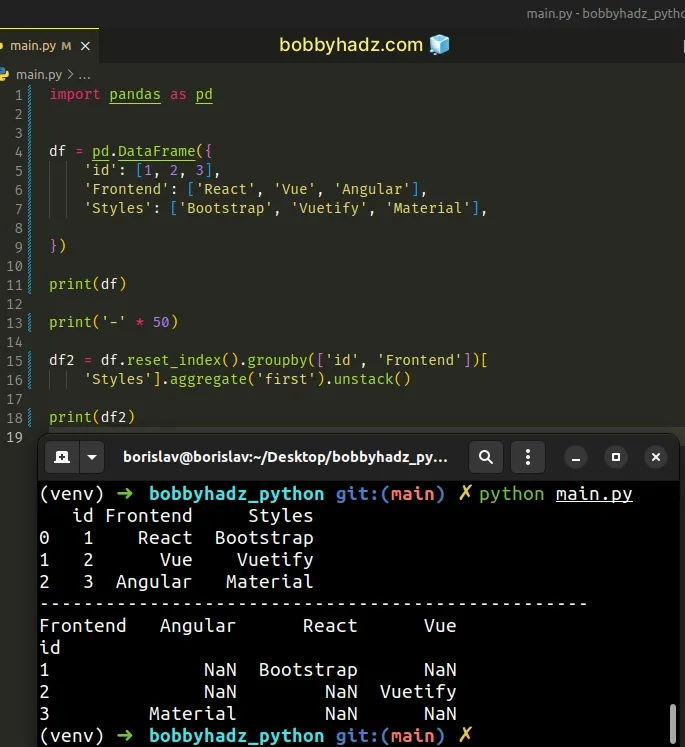
The code sample:
- Resets the
DataFrameindex using reset_index().
# index id Frontend Styles # 0 0 1 React Bootstrap # 1 1 2 Vue Vuetify # 2 2 3 Angular Material print(df.reset_index())
- The
groupby()
method groups the
DataFrameby a series of columns. - We then aggregate using DataFrame.first().
- The
DataFrame.unstack()
method returns a
DataFramewith a new level of column labels whose innermost level consists of the pivoted index labels.
You can achieve a similar result by using DataFrame.set_index().
import pandas as pd df = pd.DataFrame({ 'Frontend': ['React', 'Vue', 'Angular'], 'Styles': ['Bootstrap', 'Vuetify', 'Material'], }) print(df) print('-' * 50) df2 = df.set_index([df.index, 'Frontend'])['Styles'].unstack() print(df2)
Running the code sample produces the following output.
Frontend Styles 0 React Bootstrap 1 Vue Vuetify 2 Angular Material -------------------------------------------------- Frontend Angular React Vue 0 NaN Bootstrap NaN 1 NaN NaN Vuetify 2 Material NaN NaN
# Additional Resources
You can learn more about the related topics by checking out the following tutorials:
- How to use numpy.argsort in Descending order in Python
- Object arrays cannot be loaded when allow_pickle=False
- ValueError: Found array with dim 3. Estimator expected 2
- Input contains infinity or value too large for dtype(float64)
- RuntimeWarning: overflow encountered in exp [Solved]
- RuntimeError: This event loop is already running [Solved]
- Drop Unnamed: 0 columns from a Pandas DataFrame in Python
- Get the first Row of each Group in a Pandas DataFrame
- ValueError: No axis named X for object type DataFrame
- Pandas: Make new Column from string Slice of another Column
- Pandas: Calculate mean (average) across multiple DataFrames
- Pandas: Get a List of Categories or Categorical Columns
- Only valid with DatetimeIndex, TimedeltaIndex or PeriodIndex, but got an instance of X
- Pandas: Drop columns if Name contains a given String
- Pandas: Find first and last non-NaN values in a DataFrame
- How to shuffle two NumPy Arrays together (in Unison)
- Pandas: Out of bounds nanosecond timestamp [Solved]
- How to get a Quarter from a Date in Pandas [4 Ways]
- Pandas: Find the percentage of Missing values in each Column
- Create Date column from Year, Month and Day in Pandas
- Pandas ValueError: Cannot index with multidimensional key
- ValueError: Grouper for 'X' not 1-dimensional [Solved]
- Cannot subset columns with tuple with more than one element
- Pandas: Get Nth row or every Nth row in a DataFrame
- Pandas: Convert a DataFrame to a List of Dictionaries
- Pandas: GroupBy columns with NaN (missing) values
- Pandas: Merge only specific DataFrame columns
- How to modify a Subset of Rows in a Pandas DataFrame
- How to Start the Index of a Pandas DataFrame at 1
- Pandas: DataFrame.reset_index() not working [Solved]
- How to Add Axis Labels to a Plot in Pandas [5 Ways]
- How to Create a Set from a Series in Pandas
- ValueError: If using all scalar values, you must pass index
- How to Split a Pandas DataFrame into Chunks
- Pandas: How to Query a Column name with Spaces
- Pandas: Find the closest value to a Number in a Column
- Annotate Bars in Barplot with Pandas and Matplotlib
- Pandas: Create a Tuple from two DataFrame Columns
- Cannot mask with non-boolean array containing NA / NaN values
- Disable the TOKENIZERS_PARALLELISM=(true | false) warning
- RuntimeError: Expected scalar type Float but found Double
- Pandas: Convert timezone-aware DateTimeIndex to naive timestamp
- RuntimeError: Input type (torch.FloatTensor) and weight type (torch.cuda.FloatTensor) should be the same
- ValueError: Failed to convert a NumPy array to a Tensor (Unsupported object type float)
- Mixing dicts with non-Series may lead to ambiguous ordering
- ValueError: NaTType does not support strftime [Solved]
- Must have equal len keys and value when setting with iterable
- Cannot convert non-finite values (NA or inf) to integer
- Pandas: How to efficiently Read a Large CSV File
- TypeError: '(slice(None, None, None), 0)' is an invalid key
- ERROR: YouTube said: Unable to extract video data [Solved]
- OSError: [E050] Can't find model 'en_core_web_sm'
- PyTorch: Trying to backward through the graph a second time