Pandas: Calculate mean (average) across multiple DataFrames
Last updated: Apr 12, 2024
Reading time·5 min

# Table of Contents
- Pandas: Calculate mean (average) across multiple DataFrames
- Calculate mean across multiple DataFrames by row index
- Calculate mean across multiple DataFrames by row index using stack() and unstack()
- Pandas: Calculate median across multiple DataFrames
# Pandas: Calculate mean (average) across multiple DataFrames
To calculate the mean (average) across multiple DataFrames():
- Use the
pandas.concat()method to concatenate the DataFrames. - Call the
mean()method on the resultingDataFrameto get the mean of the values.
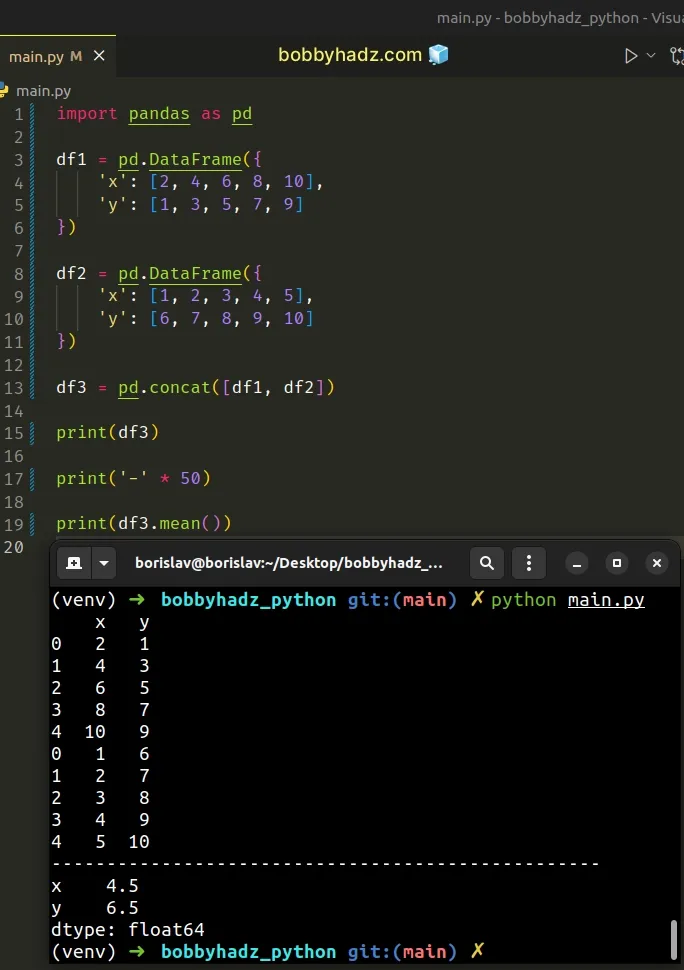
import pandas as pd df1 = pd.DataFrame({ 'x': [2, 4, 6, 8, 10], 'y': [1, 3, 5, 7, 9] }) df2 = pd.DataFrame({ 'x': [1, 2, 3, 4, 5], 'y': [6, 7, 8, 9, 10] }) df3 = pd.concat([df1, df2]) print(df3) print('-' * 50) print(df3.mean())
Running the code sample returns the following output.
x y 0 2 1 1 4 3 2 6 5 3 8 7 4 10 9 0 1 6 1 2 7 2 3 8 3 4 9 4 5 10 -------------------------------------------------- x 4.5 y 6.5 dtype: float64
We used the pandas.concat() method to concatenate the two DataFrames along the index axis.
As a result, we got a new DataFrame that contains the rows of both DataFrames.
import pandas as pd df1 = pd.DataFrame({ 'x': [2, 4, 6, 8, 10], 'y': [1, 3, 5, 7, 9] }) df2 = pd.DataFrame({ 'x': [1, 2, 3, 4, 5], 'y': [6, 7, 8, 9, 10] }) df3 = pd.concat([df1, df2]) # x y # 0 2 1 # 1 4 3 # 2 6 5 # 3 8 7 # 4 10 9 # 0 1 6 # 1 2 7 # 2 3 8 # 3 4 9 # 4 5 10 print(df3)
The last step is to call the DataFrame.mean()
method on the resulting DataFrame.
# x 4.5 # y 6.5 # dtype: float64 print(df3.mean())
The method returns the mean of the values over the requested axis (the index
axis by default).
The mean (or average) is calculated by:
- Adding the numbers in the column together.
- Dividing the total sum by the number of scores.
# Calculate mean across multiple DataFrames by row index
If you want to calculate the mean values across multiple DataFrames by row index, use the DataFrame.groupby() method.
import pandas as pd df1 = pd.DataFrame({ 'x': [2, 4, 6, 8, 10], 'y': [1, 3, 5, 7, 9] }) df2 = pd.DataFrame({ 'x': [1, 2, 3, 4, 5], 'y': [6, 7, 8, 9, 10] }) df3 = pd.concat([df1, df2]) print(df3) by_row_index = df3.groupby(df3.index) mean_values = by_row_index.mean() print('-' * 50) print(mean_values)
Running the code sample produces the following output.
x y 0 2 1 1 4 3 2 6 5 3 8 7 4 10 9 0 1 6 1 2 7 2 3 8 3 4 9 4 5 10 -------------------------------------------------- x y 0 1.5 3.5 1 3.0 5.0 2 4.5 6.5 3 6.0 8.0 4 7.5 9.5
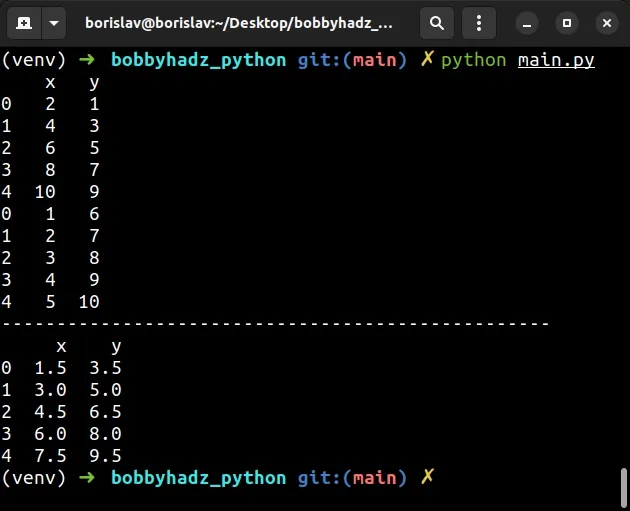
We grouped the DataFrame by the index column.
0, index 1, etc).This approach works even if the two DataFrames have a different number of rows.
import pandas as pd df1 = pd.DataFrame({ 'x': [2, 4, 6, 8, 10], 'y': [1, 3, 5, 7, 9] }) df2 = pd.DataFrame({ 'x': [1, 2, 3], 'y': [6, 7, 8] }) df3 = pd.concat([df1, df2]) print(df3) by_row_index = df3.groupby(df3.index) mean_values = by_row_index.mean() print('-' * 50) print(mean_values)
Running the code sample produces the following output.
x y 0 2 1 1 4 3 2 6 5 3 8 7 4 10 9 0 1 6 1 2 7 2 3 8 -------------------------------------------------- x y 0 1.5 3.5 1 3.0 5.0 2 4.5 6.5 3 8.0 7.0 4 10.0 9.0
If a row index is missing in one of the DataFrames, the mean is computed on the single available row.
# Calculate mean across multiple DataFrames by row index using stack() and unstack()
You can also calculate the mean across multiple DataFrames by row index by using
the stack() and unstack() methods.
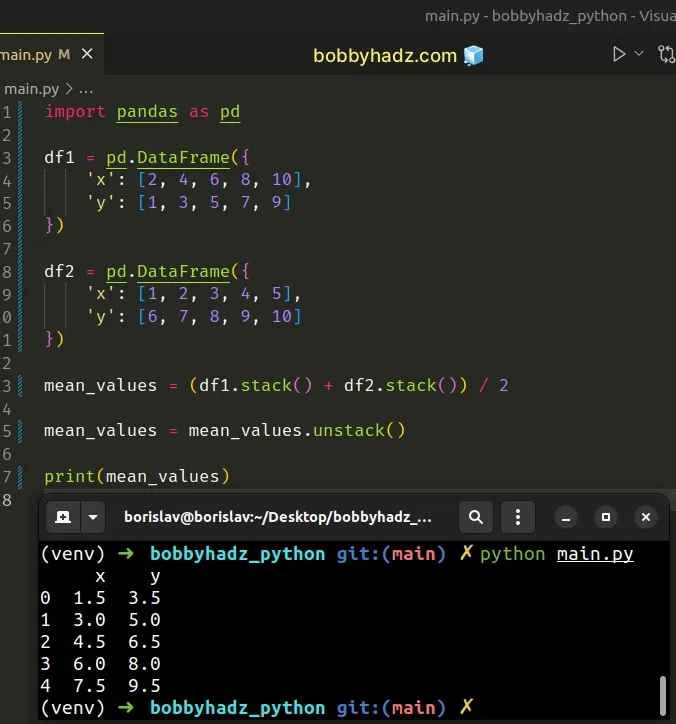
import pandas as pd df1 = pd.DataFrame({ 'x': [2, 4, 6, 8, 10], 'y': [1, 3, 5, 7, 9] }) df2 = pd.DataFrame({ 'x': [1, 2, 3, 4, 5], 'y': [6, 7, 8, 9, 10] }) mean_values = (df1.stack() + df2.stack()) / 2 mean_values = mean_values.unstack() print(mean_values)
Running the code sample produces the following output.
x y 0 1.5 3.5 1 3.0 5.0 2 4.5 6.5 3 6.0 8.0 4 7.5 9.5
The DataFrame.stack method stacks the prescribed level(s) from columns to
index.
import pandas as pd df1 = pd.DataFrame({ 'x': [2, 4, 6, 8, 10], 'y': [1, 3, 5, 7, 9] }) # 0 x 2 # y 1 # 1 x 4 # y 3 # 2 x 6 # y 5 # 3 x 8 # y 7 # 4 x 10 # y 9 # dtype: int64 print(df1.stack())
The method returns the stacked DataFrame.
We stacked the two DataFrames and divided the result by 2.
mean_values = (df1.stack() + df2.stack()) / 2 mean_values = mean_values.unstack()
The last step is to use the
DataFrame.unstack
method to unstack the resulting DataFrame.
The method returns a DataFrame that has a new level of column labels whose
innermost level consists of the pivoted index labels.
# Pandas: Calculate median across multiple DataFrames
If you need to find the median across the two DataFrames, use the DataFrame.median method instead.
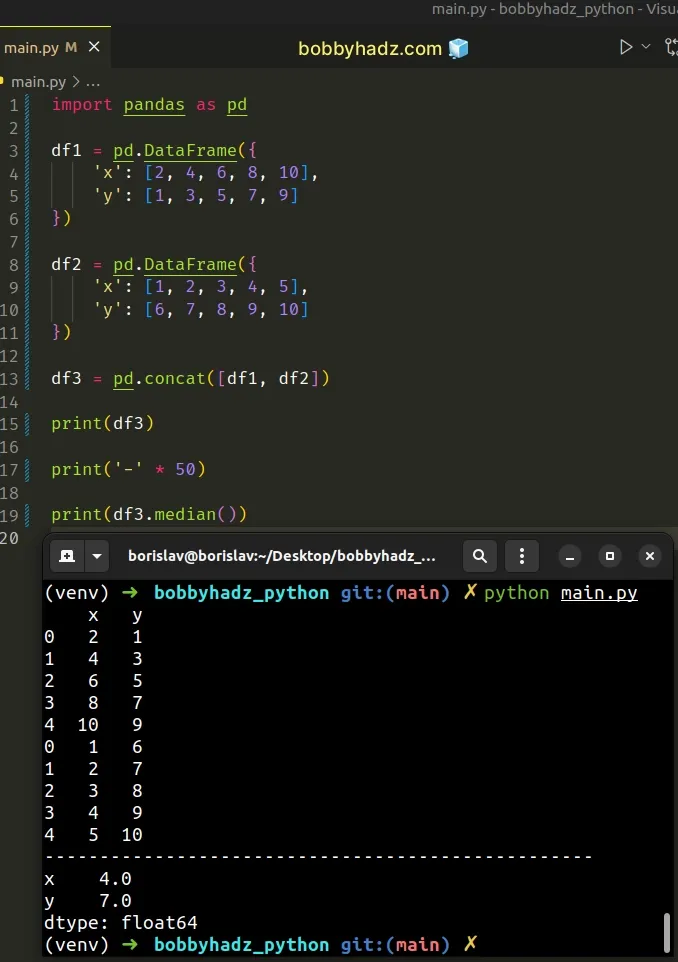
import pandas as pd df1 = pd.DataFrame({ 'x': [2, 4, 6, 8, 10], 'y': [1, 3, 5, 7, 9] }) df2 = pd.DataFrame({ 'x': [1, 2, 3, 4, 5], 'y': [6, 7, 8, 9, 10] }) df3 = pd.concat([df1, df2]) print(df3) print('-' * 50) print(df3.median())
Running the code sample produces the following output.
x y 0 2 1 1 4 3 2 6 5 3 8 7 4 10 9 0 1 6 1 2 7 2 3 8 3 4 9 4 5 10 -------------------------------------------------- x 4.0 y 7.0 dtype: float64
The DataFrame.median() method returns the median of the values over the
requested axis (the index axis by default).
The median is calculated by:
- Arranging the numbers from the smallest to the largest.
- If the number of data points is odd, the median is the middle data point.
- If the number is even, the median is the average of the two middle data points.
# Additional Resources
You can learn more about the related topics by checking out the following tutorials:
- TypeError: 'numpy.ndarray' object is not callable in Python
- TypeError: Object of type ndarray is not JSON serializable
- IndexError: too many indices for array in Python [Solved]
- How to filter a JSON array in Python
- ValueError: object too deep for desired array [Solved]
- Only one element tensors can be converted to Python scalars
- Replace negative Numbers in a Pandas DataFrame with Zero
- Pandas: Sum the values in a Column that match a Condition
- Pandas: Make new Column from string Slice of another Column
- Calculate the average (mean) of 2 NumPy arrays
- Reading specific columns from an Excel File in Pandas
- How to drop all Rows in a Pandas DataFrame in Python
- How to repeat Rows N times in a Pandas DataFrame
- Pandas: Unalignable boolean Series provided as indexer