Pandas: Find the percentage of Missing values in each Column
Last updated: Apr 12, 2024
Reading time·5 min

# Table of Contents
- Pandas: Find the percentage of Missing values in each Column
- Getting the results in a new DataFrame
- Sorting the new DataFrame by the percent_missing column
- Find the percentage of Missing values in each Column using mean()
# Pandas: Find the percentage of Missing values in each Column
To find the percentage of missing values in each column in a Pandas DataFrame:
- Use the
DataFrame.isnull()method to detect the missing values in theDataFrame. - Sum the missing values, multiply the sum by
100and divide the result by the length of theDataFrame.
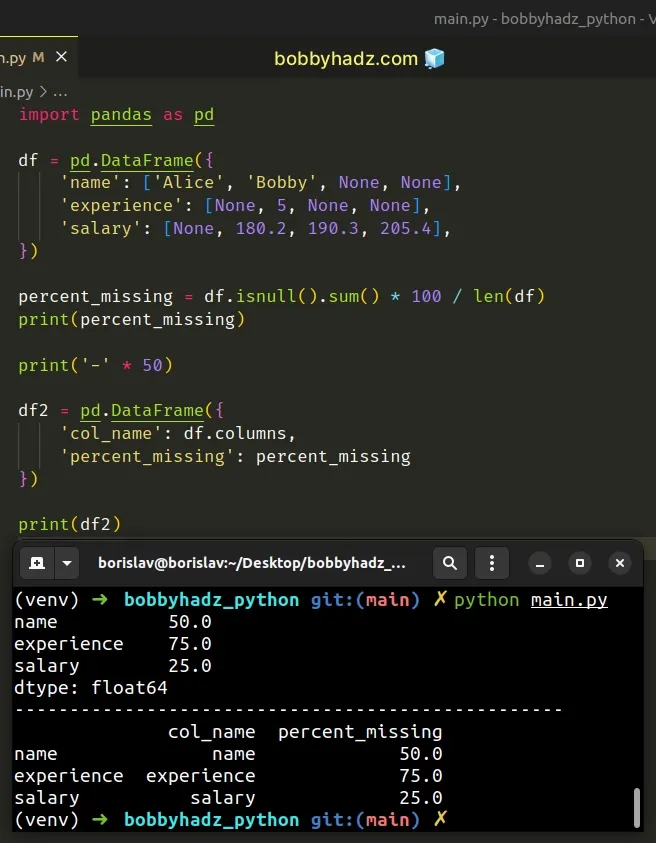
import pandas as pd df = pd.DataFrame({ 'name': ['Alice', 'Bobby', None, None], 'experience': [None, 5, None, None], 'salary': [None, 180.2, 190.3, 205.4], }) percent_missing = df.isnull().sum() * 100 / len(df) print(percent_missing) print('-' * 50) df2 = pd.DataFrame({ 'col_name': df.columns, 'percent_missing': percent_missing }) print(df2)
Running the code sample produces the following output.
name 50.0 experience 75.0 salary 25.0 dtype: float64 -------------------------------------------------- col_name percent_missing name name 50.0 experience experience 75.0 salary salary 25.0
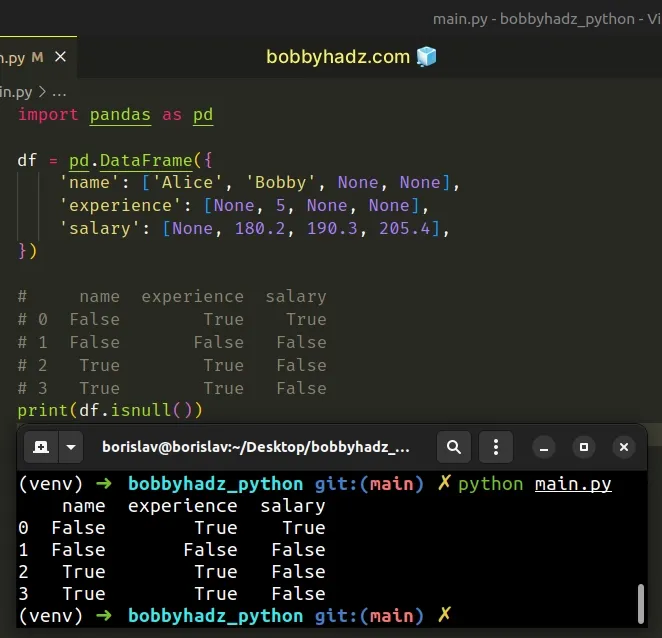
The
DataFrame.isnull()
method detects the missing values in the DataFrame.
The method returns True for each missing value and False otherwise.
import pandas as pd df = pd.DataFrame({ 'name': ['Alice', 'Bobby', None, None], 'experience': [None, 5, None, None], 'salary': [None, 180.2, 190.3, 205.4], }) # name experience salary # 0 False True True # 1 False False False # 2 True True False # 3 True True False print(df.isnull())
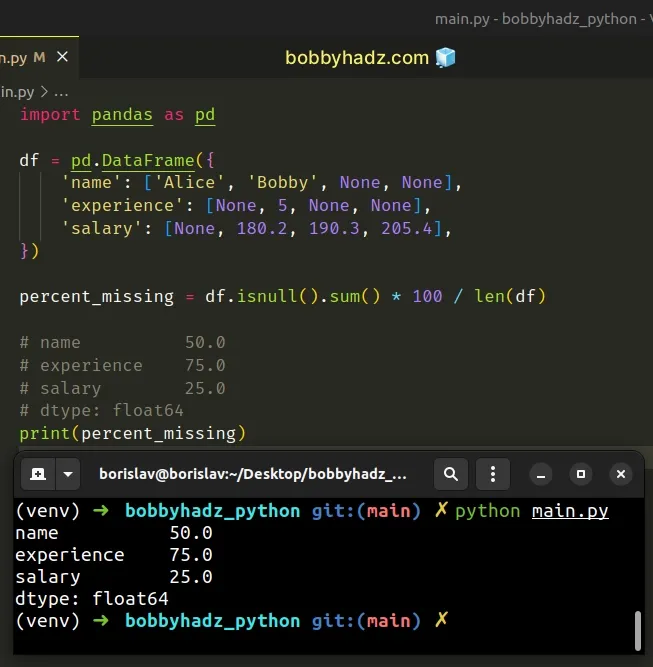
To get the number of missing values in each column as a percentage, multiply the
sum by 100 and divide the result by the DataFrame's length.
import pandas as pd df = pd.DataFrame({ 'name': ['Alice', 'Bobby', None, None], 'experience': [None, 5, None, None], 'salary': [None, 180.2, 190.3, 205.4], }) percent_missing = df.isnull().sum() * 100 / len(df) # name 50.0 # experience 75.0 # salary 25.0 # dtype: float64 print(percent_missing)
# Getting the results in a new DataFrame
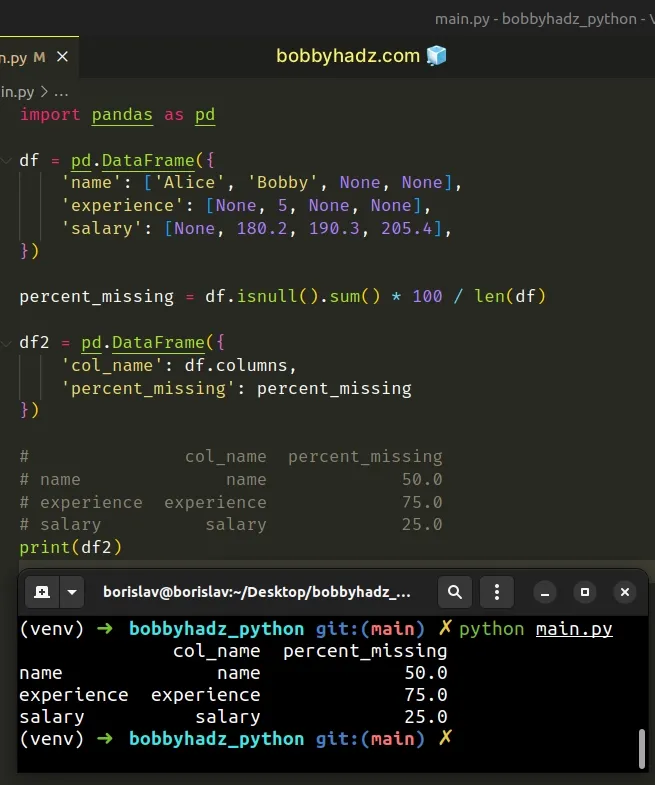
If you need to get the percentage of missing values in each column in a
DataFrame, use the pd.DataFrame() class.
import pandas as pd df = pd.DataFrame({ 'name': ['Alice', 'Bobby', None, None], 'experience': [None, 5, None, None], 'salary': [None, 180.2, 190.3, 205.4], }) percent_missing = df.isnull().sum() * 100 / len(df) df2 = pd.DataFrame({ 'col_name': df.columns, 'percent_missing': percent_missing }) # col_name percent_missing # name name 50.0 # experience experience 75.0 # salary salary 25.0 print(df2)
# Sorting the new DataFrame by the percent_missing column
If you need to sort the new DataFrame by the percent_missing column, use the
sort_values() method.
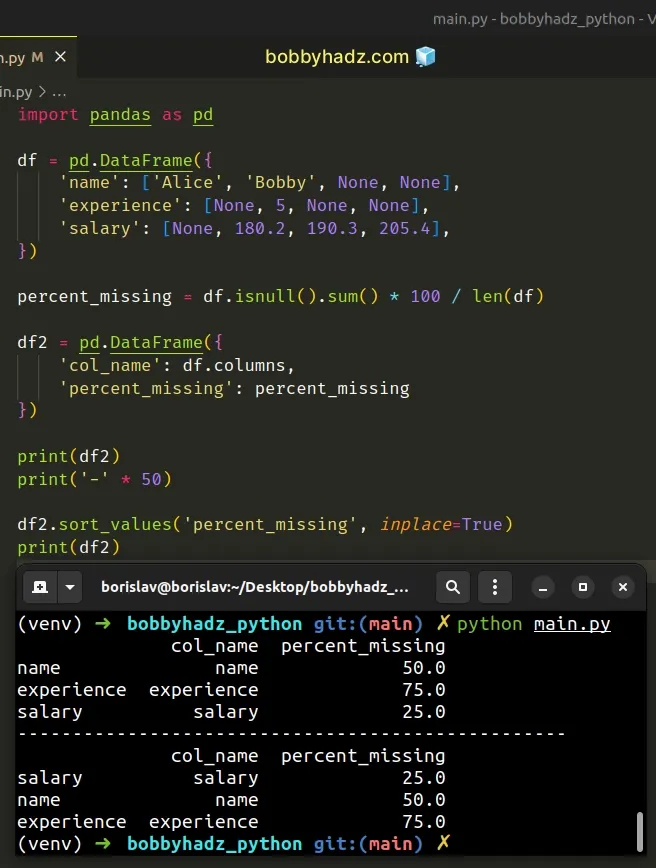
import pandas as pd df = pd.DataFrame({ 'name': ['Alice', 'Bobby', None, None], 'experience': [None, 5, None, None], 'salary': [None, 180.2, 190.3, 205.4], }) percent_missing = df.isnull().sum() * 100 / len(df) df2 = pd.DataFrame({ 'col_name': df.columns, 'percent_missing': percent_missing }) print(df2) print('-' * 50) df2.sort_values('percent_missing', inplace=True) print(df2)
Running the code sample produces the following output.
col_name percent_missing name name 50.0 experience experience 75.0 salary salary 25.0 -------------------------------------------------- col_name percent_missing salary salary 25.0 name name 50.0 experience experience 75.0
The
DataFrame.sort_values
method sorts the values in the DataFrame along a given axis.
# Find the percentage of Missing values in each Column using mean()
You can also use the isnull() and mean() methods to find the percentage of
missing values in each column in a Pandas DataFrame.
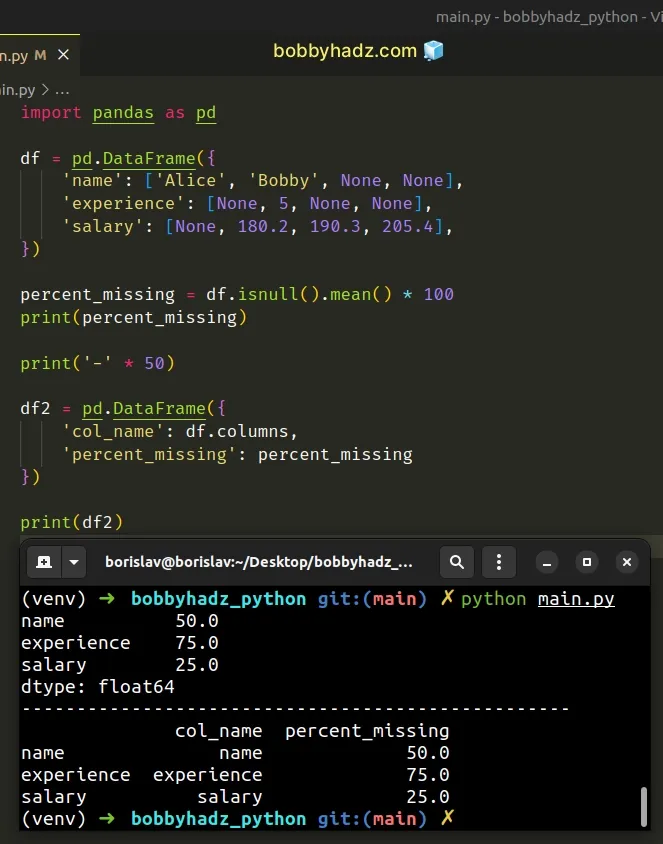
import pandas as pd df = pd.DataFrame({ 'name': ['Alice', 'Bobby', None, None], 'experience': [None, 5, None, None], 'salary': [None, 180.2, 190.3, 205.4], }) percent_missing = df.isnull().mean() * 100 print(percent_missing) print('-' * 50) df2 = pd.DataFrame({ 'col_name': df.columns, 'percent_missing': percent_missing }) print(df2)
Running the code sample produces the following output.
name 50.0 experience 75.0 salary 25.0 dtype: float64 -------------------------------------------------- col_name percent_missing name name 50.0 experience experience 75.0 salary salary 25.0
We used the isnull() method to detect the missing values in each column and
then called the DataFrame.mean method on the
result.
percent_missing = df.isnull().mean() * 100 # name 50.0 # experience 75.0 # salary 25.0 # dtype: float64 print(percent_missing)
The DataFrame.mean method returns the mean of the values over the requested
axis.
The last step is to multiply the result by 100 to get the percentage of
missing values.
If you need to convert the result to a DataFrame, use the pd.DataFrame
class.
df2 = pd.DataFrame({ 'col_name': df.columns, 'percent_missing': percent_missing }) # col_name percent_missing # name name 50.0 # experience experience 75.0 # salary salary 25.0 print(df2)
You can also use the mul() method for the multiplication.
import pandas as pd df = pd.DataFrame({ 'name': ['Alice', 'Bobby', None, None], 'experience': [None, 5, None, None], 'salary': [None, 180.2, 190.3, 205.4], }) percent_missing = df.isnull().mean().round(4).mul(100) # name 50.0 # experience 75.0 # salary 25.0 # dtype: float64 print(percent_missing)
If you need to sort the values, use the sort_values() method and set the
ascending argument to True or False.
import pandas as pd df = pd.DataFrame({ 'name': ['Alice', 'Bobby', None, None], 'experience': [None, 5, None, None], 'salary': [None, 180.2, 190.3, 205.4], }) percent_missing = df.isnull().mean().round( 4).mul(100).sort_values(ascending=True) # salary 25.0 # name 50.0 # experience 75.0 # dtype: float64 print(percent_missing)
The code sample sorts the values in ascending order, but you can also sort them
in descending order by setting ascending to False.
You can also pass the result to the pd.DataFrame() class to convert it to a
DataFrame.
import pandas as pd df = pd.DataFrame({ 'name': ['Alice', 'Bobby', None, None], 'experience': [None, 5, None, None], 'salary': [None, 180.2, 190.3, 205.4], }) percent_missing = pd.DataFrame( df.isnull().mean().round(4).mul(100).sort_values(ascending=True), columns=['percent_missing'] ) # percent_missing # salary 25.0 # name 50.0 # experience 75.0 print(percent_missing)
# Additional Resources
You can learn more about the related topics by checking out the following tutorials:
- Pandas: Drop columns if Name contains a given String
- Pandas: Convert GroupBy results to Dictionary of Lists
- Cannot perform 'rand_' with a dtyped [int64] array and scalar of type [bool]
- How to remove Time from DateTime in Pandas [5 Ways]
- Pandas: Check if a Date is during the Weekend or Weekday
- Pandas ValueError: Cannot index with multidimensional key
- ValueError: Grouper for 'X' not 1-dimensional [Solved]
- Check if all values in a Column are Equal in Pandas
- Pandas: Get Nth row or every Nth row in a DataFrame
- Pandas: Find common Rows (intersection) between 2 DataFrames
- Pandas: Select Rows between two values in DataFrame
- Filter rows in a Pandas DataFrame using Regex
- Pandas: How to keep the Index when merging DataFrames
- Pandas: Merge only specific DataFrame columns
- How to Start the Index of a Pandas DataFrame at 1
- Pandas: DataFrame.reset_index() not working [Solved]
- How to Add Axis Labels to a Plot in Pandas [5 Ways]
- How to Create a Set from a Series in Pandas
- Pandas: Remove non-numeric rows in a DataFrame column
- NumPy: Apply a Mask from one Array to another Array
- Pandas: Select rows based on a List of Indices