How to Add Axis Labels to a Plot in Pandas [5 Ways]
Last updated: Apr 12, 2024
Reading time·4 min

# Table of Contents
- How to Add Axis Labels to a Plot in Pandas
- Add Axis Labels to a Plot in Pandas using set_xlabel and set_ylabel
- Add Axis Labels to a Plot in Pandas using plt.xlabel() and plt.ylabel()
- Setting the x-axis label by setting the DataFrame index name
- Add Axis Labels to a Plot in Pandas using axes.set()
# How to Add Axis Labels to a Plot in Pandas
To add axis labels to a Plot in Pandas:
- Call the
DataFrame.plot()method. - Set the axis labels by supplying the
xlabelandylabelarguments to the method.
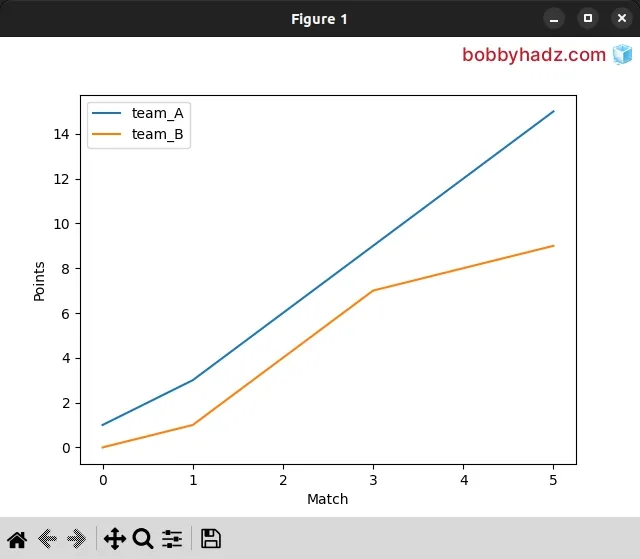
import pandas as pd import matplotlib.pyplot as plt df = pd.DataFrame({ 'team_A': [1, 3, 6, 9, 12, 15], 'team_B': [0, 1, 4, 7, 8, 9], }) df.plot(xlabel='Match', ylabel='Points') plt.show()
Make sure you have the pandas and matplotlib modules installed.
pip install pandas matplotlib pip3 install pandas matplotlib
The
DataFrame.plot()
method makes plots of Series or DataFrame.
We passed the xlabel and ylabel arguments to the method to add axis labels
to the plot.
df.plot(xlabel='Match', ylabel='Points')
The xlabel argument sets the name that should be used for the label on the
x-axis.
By default, the method uses the index name as xlabel.
The ylabel argument sets the name that should be used for the label on the
y-axis.
By default, no ylabel is shown.
xlabel and ylabel.For example, if you only want to show the x-axis label, only pass a value for
the xlabel argument and vice versa.
# Add Axis Labels to a Plot in Pandas using set_xlabel and set_ylabel
You can also use the Axes.set_xlabel and Axes.set_ylabel methods to add
axis labels to a plot in Pandas.
import pandas as pd import matplotlib.pyplot as plt df = pd.DataFrame({ 'team_A': [1, 3, 6, 9, 12, 15], 'team_B': [0, 1, 4, 7, 8, 9], }) axes = df.plot() axes.set_xlabel('Match') axes.set_ylabel('Points') plt.show()
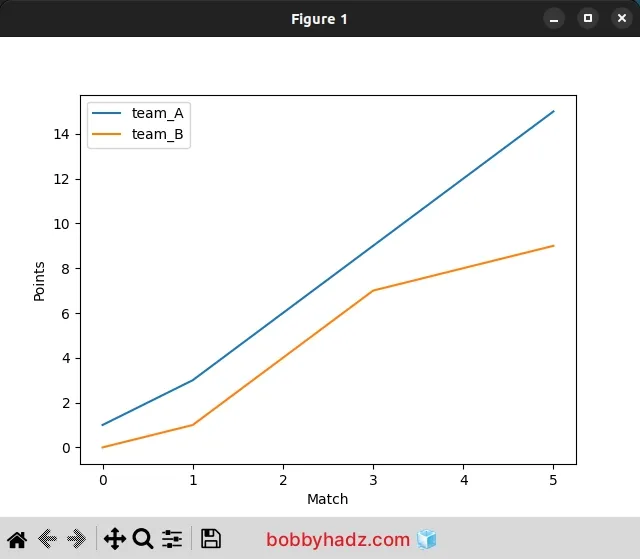
The set_xlabel() method sets the label for the x-axis.
Similarly, the set_ylabel() method sets the label for the y-axis.
# Add Axis Labels to a Plot in Pandas using plt.xlabel() and plt.ylabel()
You can also use the plt.xlabel() and plt.ylabel() methods to achieve the
same result.
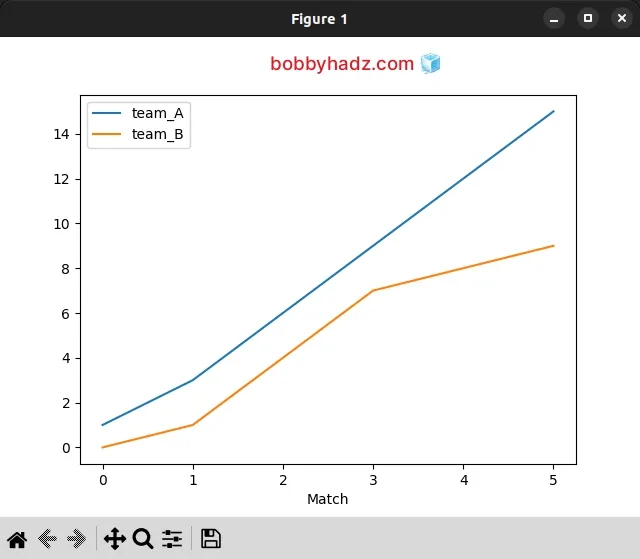
import pandas as pd import matplotlib.pyplot as plt df = pd.DataFrame({ 'team_A': [1, 3, 6, 9, 12, 15], 'team_B': [0, 1, 4, 7, 8, 9], }) df.plot() plt.xlabel('Match') plt.ylabel('Points') plt.show()

The pyplot.xlabel() method sets the label for the x-axis.
The pyplot.ylabel() method sets the label for the y-axis.
Make sure to call the xlabel() and ylabel() methods after you call
df.plot(), otherwise, you'd get two plots.
# Setting the x-axis label by setting the DataFrame index name
You can also set the x-axis label by setting the index name of the DataFrame.
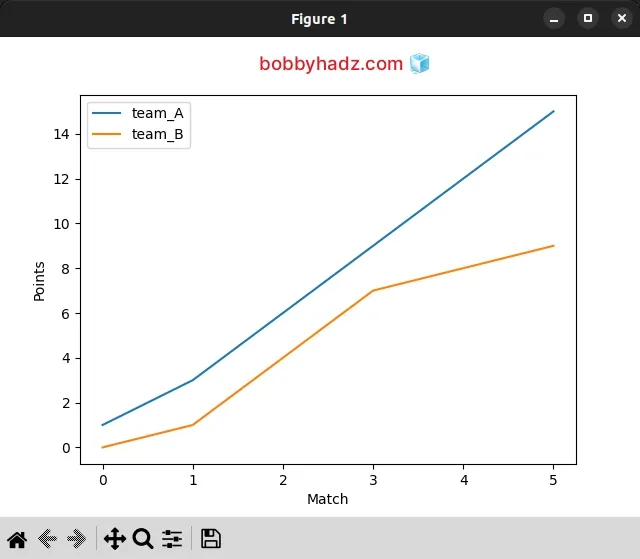
import pandas as pd import matplotlib.pyplot as plt df = pd.DataFrame({ 'team_A': [1, 3, 6, 9, 12, 15], 'team_B': [0, 1, 4, 7, 8, 9], }) df.index.name = 'Match' df.plot() plt.show()
By default, the x-axis label uses the index name.
We set the index.name attribute on the DataFrame to "Match", so this is
what gets used for the x-axis label.
However, note that the y-axis label is not shown by default, so you would still need to use one of the previous approaches if you also need to show it.
# Add Axis Labels to a Plot in Pandas using axes.set()
You can also use the axes.set() method to add axis labels to a plot in Pandas.
import pandas as pd import matplotlib.pyplot as plt df = pd.DataFrame({ 'team_A': [1, 3, 6, 9, 12, 15], 'team_B': [0, 1, 4, 7, 8, 9], }) axes = df.plot() axes.set(xlabel='Match', ylabel='Points') plt.show()
We passed the xlabel and ylabel arguments to the axes.set() method to set
labels for the x and y axes.
# Additional Resources
You can learn more about the related topics by checking out the following tutorials:
- Pandas: Split a Column of Lists into Multiple Columns
- Pandas: Merge only specific DataFrame columns
- How to modify a Subset of Rows in a Pandas DataFrame
- How to Start the Index of a Pandas DataFrame at 1
- Pandas: DataFrame.reset_index() not working [Solved]
- Pandas TypeError: no numeric data to plot [Solved]
- Pandas: How to Convert a Pivot Table to a DataFrame
- Pandas: Count the unique combinations of two Columns
- Pandas: Get the Business Days between two Dates
- Pandas: How to Query a Column name with Spaces
- Pandas: Create Scatter plot from multiple DataFrame columns
- Cannot mask with non-boolean array containing NA / NaN values
- Disable the TOKENIZERS_PARALLELISM=(true | false) warning
- RuntimeError: Expected scalar type Float but found Double
- Pandas: Convert timezone-aware DateTimeIndex to naive timestamp
- RuntimeError: Input type (torch.FloatTensor) and weight type (torch.cuda.FloatTensor) should be the same
- ValueError: Failed to convert a NumPy array to a Tensor (Unsupported object type float)
- Must have equal len keys and value when setting with iterable
- Cannot convert non-finite values (NA or inf) to integer
- Pandas: How to efficiently Read a Large CSV File
- RuntimeError: CUDA out of memory. Tried to allocate X MiB
- OSError: [E050] Can't find model 'en_core_web_sm'