How to add a Count Column to a Pandas DataFrame
Last updated: Apr 12, 2024
Reading time·6 min

# Table of Contents
- How to add a Count Column to a Pandas DataFrame
- Adding a Count Column to a Pandas DataFrame by grouping multiple columns
- Adding a Count Column to a Pandas DataFrame by using np.zeros()
- Creating a new DataFrame that has a count column
# How to add a Count Column to a Pandas DataFrame
To add a count column to a Pandas DataFrame:
- Use the
DataFrame.groupby()method to group the DataFrame by a given column. - Use the
DataFrame.transform()method to call thecountfunction on each row. - Assign the result to a column using bracket notation.
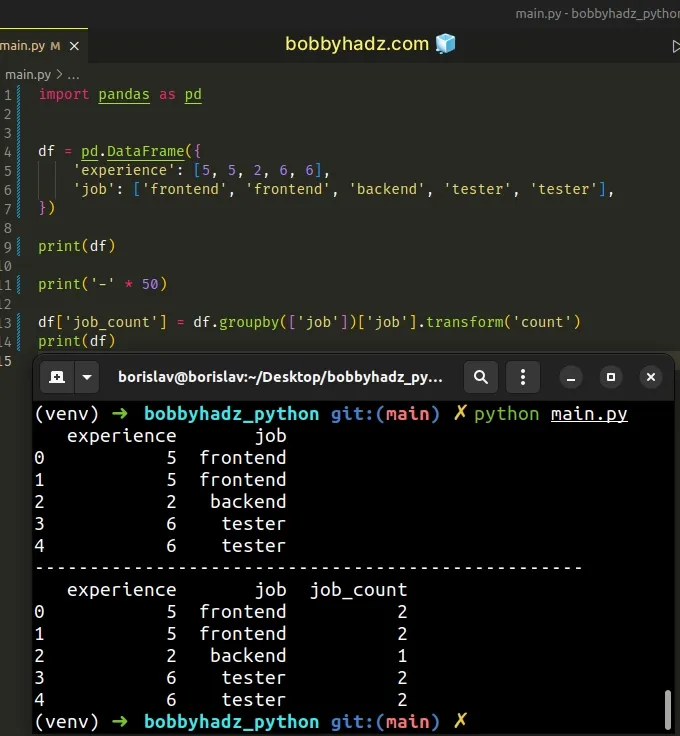
import pandas as pd df = pd.DataFrame({ 'experience': [5, 5, 2, 6, 6], 'job': ['frontend', 'frontend', 'backend', 'tester', 'tester'], }) print(df) print('-' * 50) df['job_count'] = df.groupby(['job'])['job'].transform('count') print(df)
Running the code sample produces the following output.
experience job 0 5 frontend 1 5 frontend 2 2 backend 3 6 tester 4 6 tester -------------------------------------------------- experience job job_count 0 5 frontend 2 1 5 frontend 2 2 2 backend 1 3 6 tester 2 4 6 tester 2
We used the
DataFrame.groupby()
method to group the DataFrame by the job column.
df['job_count'] = df.groupby(['job'])['job'].transform('count')
The method returns a groupby object that contains information about the
groups.
The last step is to call the count method on each row using the
DataFrame.transform()
method.
The DataFrame.count() method counts the non-NA cells for each row.
The output means that:
- The
"job"column has 2 rows with the"frontend"value. - The
"job"column has 1 row with the"backend"value. - The
"job"column has 2 rows with the"tester"value.
experience job 0 5 frontend 1 5 frontend 2 2 backend 3 6 tester 4 6 tester -------------------------------------------------- experience job job_count 0 5 frontend 2 1 5 frontend 2 2 2 backend 1 3 6 tester 2 4 6 tester 2
# Adding a Count Column to a Pandas DataFrame by grouping multiple columns
In some cases, you might have to group your DataFrame by multiple columns.
You can pass as many column names as necessary to the list you call groupby()
with.
import pandas as pd df = pd.DataFrame({ 'experience': [5, 5, 2, 6, 6], 'job': ['frontend', 'frontend', 'backend', 'tester', 'tester'], }) print(df) print('-' * 50) df['job_count'] = df.groupby( ['job', 'experience'] )['job'].transform('count') print(df)
Running the code sample produces the following output.
experience job 0 5 frontend 1 5 frontend 2 2 backend 3 6 tester 4 6 tester -------------------------------------------------- experience job job_count 0 5 frontend 2 1 5 frontend 2 2 2 backend 1 3 6 tester 2 4 6 tester 2
The output means that:
- There are 2 rows where the
jobcolumn has a value offrontendand theexperiencecolumn has a value of5. - There is 1 row where the
jobcolumn has a value ofbackendand theexperiencecolumn has a value of2. - There are 2 rows where the
jobcolumn has a value oftesterand theexperiencecolumn has a value of6.
A list of column labels can be passed to group by as many columns as necessary.
# Adding a Count Column to a Pandas DataFrame by using np.zeros()
You can also create a count column that stores dummy initial values and later
gets set to the real results.
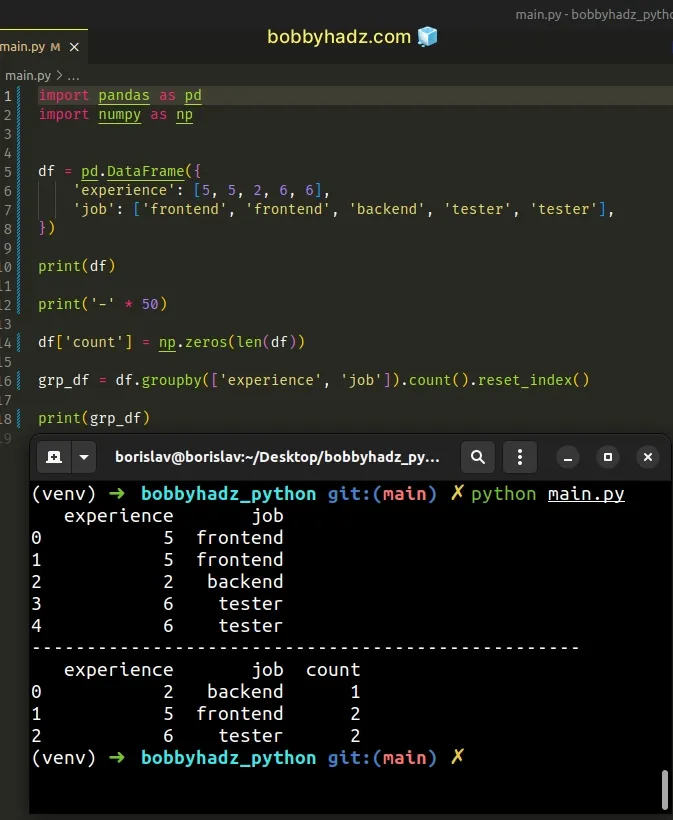
import pandas as pd import numpy as np df = pd.DataFrame({ 'experience': [5, 5, 2, 6, 6], 'job': ['frontend', 'frontend', 'backend', 'tester', 'tester'], }) print(df) print('-' * 50) df['count'] = np.zeros(len(df)) grp_df = df.groupby(['experience', 'job']).count().reset_index() print(grp_df)
Running the code sample produces the following output.
experience job 0 5 frontend 1 5 frontend 2 2 backend 3 6 tester 4 6 tester -------------------------------------------------- experience job count 0 2 backend 1 1 5 frontend 2 2 6 tester 2
Make sure you
have the numpy module installed to be
able to run the code sample.
pip install numpy pip3 install numpy
We used the numpy.zeros() method to create a count column with zeros as
initial values.
experience job count 0 5 frontend 0.0 1 5 frontend 0.0 2 2 backend 0.0 3 6 tester 0.0 4 6 tester 0.0
The real values get set from the groupby().count() call.
grp_df = df.groupby(['experience', 'job']).count().reset_index() print(grp_df)
# Creating a new DataFrame that has a count column
If you simply need to create a new DataFrame that has a count column, instead
of changing the original DataFrame, call
count() on
the groupby object.
import pandas as pd df = pd.DataFrame({ 'experience': [5, 5, 2, 6, 6], 'job': ['frontend', 'frontend', 'backend', 'tester', 'tester'], }) print(df) print('-' * 50) df2 = df.groupby(['job']).count() print(df2)
Running the code sample produces the following output.
experience job 0 5 frontend 1 5 frontend 2 2 backend 3 6 tester 4 6 tester -------------------------------------------------- experience job backend 1 frontend 2 tester 2
The output means that:
- The
"job"column has 1 row with the"backend"value. - The
"job"column has 2 rows with the"frontend"value. - The
"job"column has 2 rows with the"tester"value.
You can also use the value_counts() method.
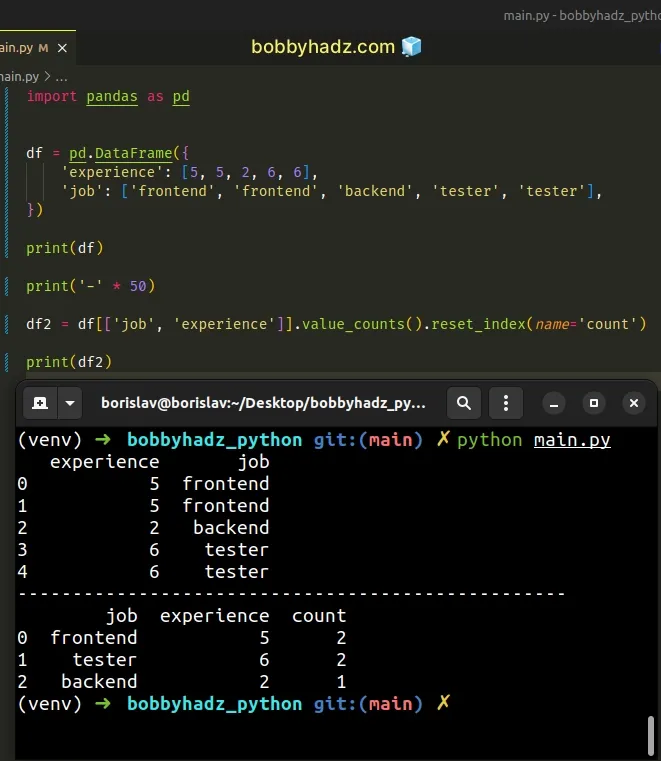
import pandas as pd df = pd.DataFrame({ 'experience': [5, 5, 2, 6, 6], 'job': ['frontend', 'frontend', 'backend', 'tester', 'tester'], }) # experience job # 0 5 frontend # 1 5 frontend # 2 2 backend # 3 6 tester # 4 6 tester print(df) print('-' * 50) df2 = df[['job', 'experience']].value_counts().reset_index(name='count') # job experience count # 0 frontend 5 2 # 1 tester 6 2 # 2 backend 2 1 print(df2)
Running the code sample produces the following output.
experience job 0 5 frontend 1 5 frontend 2 2 backend 3 6 tester 4 6 tester -------------------------------------------------- job experience count 0 frontend 5 2 1 tester 6 2 2 backend 2 1
The output means that:
- There are 2 rows where the
jobcolumn has a value offrontendand theexperiencecolumn has a value of5. - There are 2 rows where the
jobcolumn has a value oftesterand theexperiencecolumn has a value of6. - There is 1 row where the
jobcolumn has a value ofbackendand theexperiencecolumn has a value of2.
# Additional Resources
You can learn more about the related topics by checking out the following tutorials:
- Replace whole String if it contains Substring in Pandas
- Using pandas.read_csv() with multiple delimiters in Python
- Pandas: Create new row for each element in List in DataFrame
- ValueError: Cannot merge a Series without a name [Solved]
- ValueError: Length of values does not match length of index
- Reindexing only valid with uniquely valued Index objects
- Cannot concatenate object of type 'X'; only Series and DataFrame objs are valid
- Pandas: Sum the values in a Column that match a Condition
- Pandas: Find length of longest String in DataFrame column
- Cannot set a DataFrame with multiple columns to single column
- Pandas ValueError: cannot insert X, already exists [Solved]
- How to swap two DataFrame columns in Pandas
- Pandas: How to get the Max and Min Dates in a DataFrame
- Pandas SpecificationError: nested renamer is not supported
- Pandas: Select the Rows where two Columns are Equal
- Pandas: Out of bounds nanosecond timestamp [Solved]
- How to get a Quarter from a Date in Pandas [4 Ways]
- How to remove Time from DateTime in Pandas [5 Ways]
- Pandas: Check if a Date is during the Weekend or Weekday
- Create Date column from Year, Month and Day in Pandas
- Pandas: Get Nth row or every Nth row in a DataFrame
- Pandas: Find common Rows (intersection) between 2 DataFrames
- Filter rows in a Pandas DataFrame using Regex
- Pandas: Get the Rows that are NOT in another DataFrame
- Pandas: GroupBy columns with NaN (missing) values
- Panda: Using fillna() with specific columns in a DataFrame
- Pandas: Merge only specific DataFrame columns
- How to modify a Subset of Rows in a Pandas DataFrame
- How to Start the Index of a Pandas DataFrame at 1
- Pandas: DataFrame.reset_index() not working [Solved]
- How to Add Axis Labels to a Plot in Pandas [5 Ways]
- How to Create a Set from a Series in Pandas
- ValueError: If using all scalar values, you must pass index
- First argument must be an iterable of pandas objects [Fix]
- Pandas: Remove special characters from Column Values/Names
- Pandas: Find the closest value to a Number in a Column
- Annotate Bars in Barplot with Pandas and Matplotlib
- Pandas: Create a Tuple from two DataFrame Columns
- RuntimeError: Expected scalar type Float but found Double
- Pandas: Convert timezone-aware DateTimeIndex to naive timestamp
- RuntimeError: Input type (torch.FloatTensor) and weight type (torch.cuda.FloatTensor) should be the same
- How to read a .mat (Matplotlib) file in Python
- Python: How to center the Title in Plotly
- ValueError: Expected object or value with
pd.read_json() - Mixing dicts with non-Series may lead to ambiguous ordering