Count number of non-NaN values in each column of DataFrame
Last updated: Apr 11, 2024
Reading time·5 min

# Table of Contents
- Count number of non-NaN values in each column of DataFrame
- Get the total number of the non-NaN values in the
DataFrame - Counting the empty strings as NA values
- Count number of non-missing values using
notna()
# Count number of non-NaN values in each column of DataFrame
Use the count() method to count the number of non-NaN (or non-missing)
values in each column of a DataFrame.
The method counts the non-NA cells for each column or row.
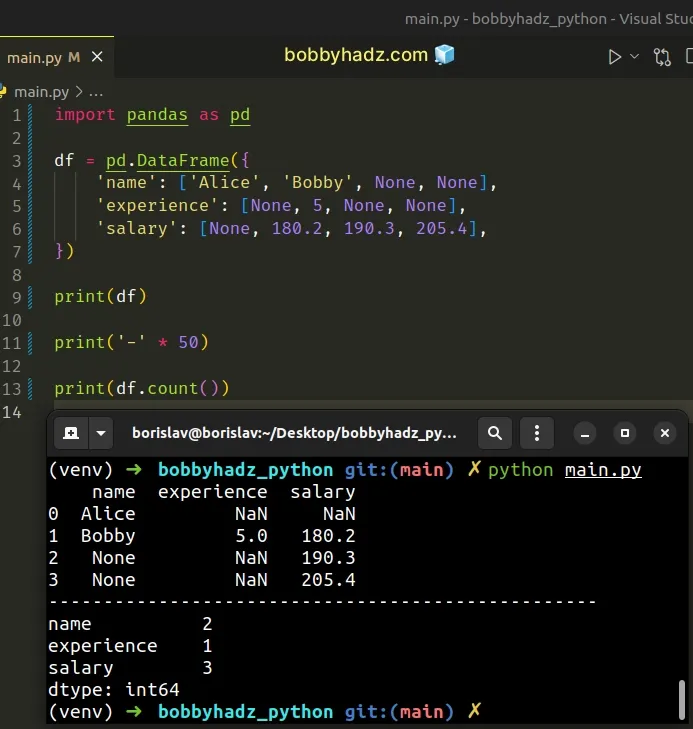
import pandas as pd df = pd.DataFrame({ 'name': ['Alice', 'Bobby', None, None], 'experience': [None, 5, None, None], 'salary': [None, 180.2, 190.3, 205.4], }) print(df) print('-' * 50) print(df.count())
Running the code sample produces the following output.
name experience salary 0 Alice NaN NaN 1 Bobby 5.0 180.2 2 None NaN 190.3 3 None NaN 205.4 -------------------------------------------------- name 2 experience 1 salary 3 dtype: int64
We used the
pandas.DataFrame()
method to create a DataFrame object.
name experience salary 0 Alice NaN NaN 1 Bobby 5.0 180.2 2 None NaN 190.3 3 None NaN 205.4
You can use the
DataFrame.count()
method to count the non-NA (or non-missing) cells for each column or row of the
DataFrame.
print(df.count())
The method produces the following output.
name 2 experience 1 salary 3 dtype: int64
- The
namecolumn has 2 non-missing values - The
experiencecolumn has 1 non-missing value - The
salarycolumn has 3 non-missing values
If you need to get the number of non-NaN (or non-missing) values in each row,
set the axis parameter to 1 when calling count().
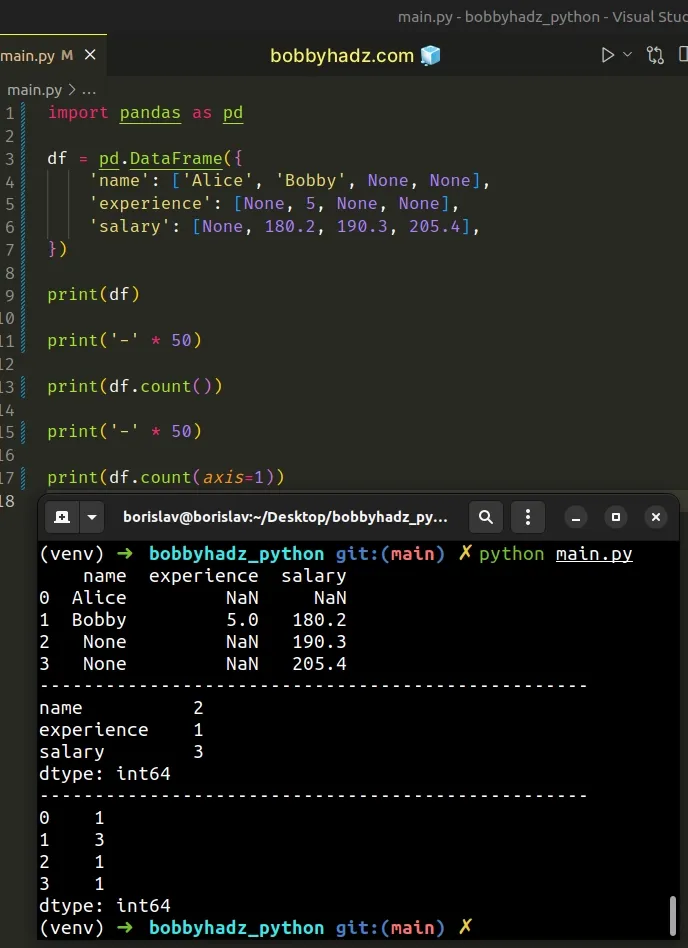
import pandas as pd df = pd.DataFrame({ 'name': ['Alice', 'Bobby', None, None], 'experience': [None, 5, None, None], 'salary': [None, 180.2, 190.3, 205.4], }) print(df) print('-' * 50) print(df.count()) print('-' * 50) print(df.count(axis=1))
Running the code sample produces the following output.
name experience salary 0 Alice NaN NaN 1 Bobby 5.0 180.2 2 None NaN 190.3 3 None NaN 205.4 -------------------------------------------------- name 2 experience 1 salary 3 dtype: int64 -------------------------------------------------- 0 1 1 3 2 1 3 1 dtype: int64
- The row at index
0(first row) has1non-missing value. - The row at index
1(second row) has3non-missing values - The row at index
2(third row) has1non-missing value. - The row at index
3(fourth row) has1non-missing value.
Technically, the DataFrame.count() method counts the non-NA cells for each
column or row.
The NA values are:
NoneNaNNaT- optionally
numpy.inf(depending onpandas.options.mode.use_inf_as_na).
The method takes an optional axis parameter.
By default, the parameter is set to 0, which means that non-NA counts are
generated for each column.
If the axis parameter is set to 1, then non-NA counts are generated for each
row.
# Get the total number of the non-NaN values in the DataFrame
If you need to get the total number of the non-NaN (or non-missing) values in
the DataFrame, use the numpy.sum() method.
First, make sure
you have the numpy module installed by
running the following command from your terminal.
pip install numpy pip3 install numpy
Now import numpy and use the numpy.sum() method as follows.
import pandas as pd import numpy as np df = pd.DataFrame({ 'name': ['Alice', 'Bobby', None, None], 'experience': [None, 5, None, None], 'salary': [None, 180.2, 190.3, 205.4], }) print(df) print('-' * 50) print(np.sum(df.count())) # 👉️ 6
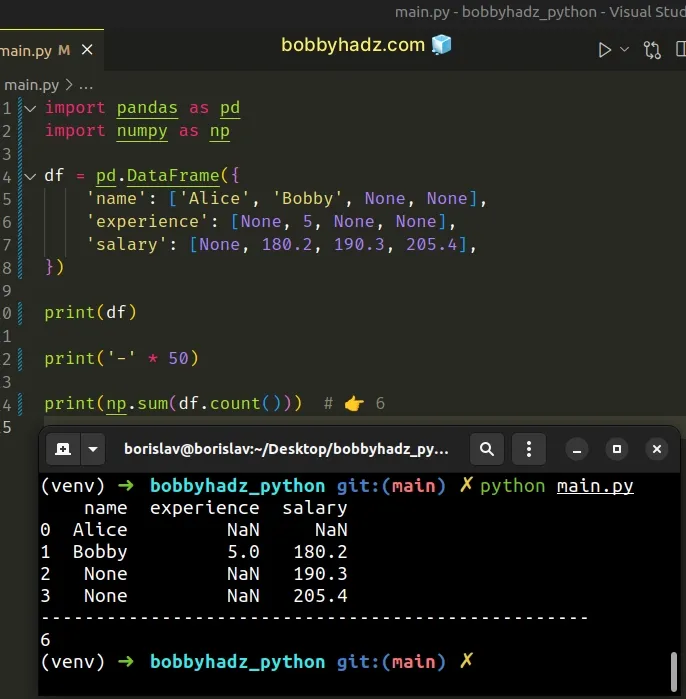
The example shows that the DataFrame contains 6 non-missing values.
The numpy.sum() method returns the sum of the array elements over a given axis.
# Counting the empty strings as NA values
In some cases, you might also want to count the empty strings as NA values.
You can use the DataFrame.replace() method to replace the empty strings with
numpy.nan before calling count().
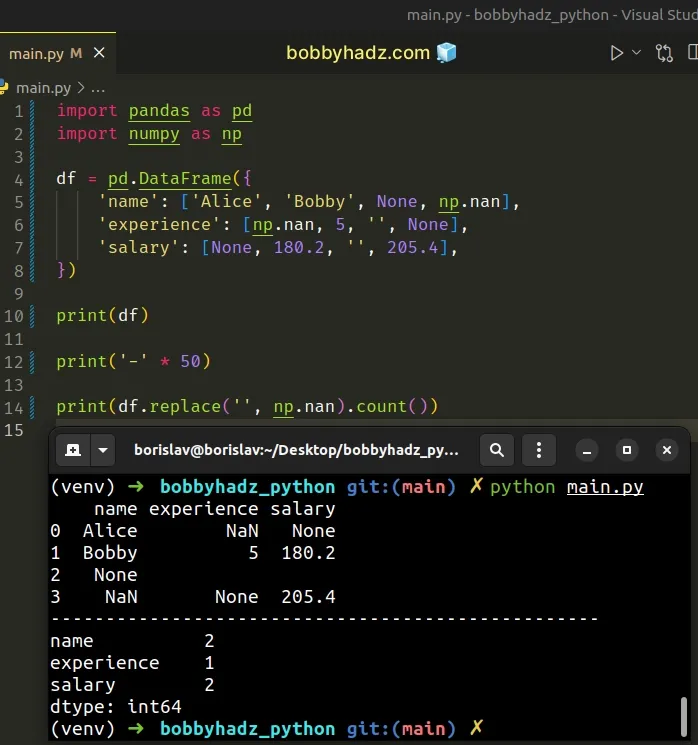
import pandas as pd import numpy as np df = pd.DataFrame({ 'name': ['Alice', 'Bobby', None, np.nan], 'experience': [np.nan, 5, '', None], 'salary': [None, 180.2, '', 205.4], }) print(df) print('-' * 50) print(df.replace('', np.nan).count())
Running the code sample produces the following output.
name experience salary 0 Alice NaN None 1 Bobby 5 180.2 2 None 3 NaN None 205.4 -------------------------------------------------- name 2 experience 1 salary 2 dtype: int64
We used the
DataFrame.replace()
method to replace each empty string with an np.nan value.
We directly called the count() method on the result, so the empty strings are
counted as NA values.
# Count number of non-missing values using notna()
You can also use the DataFrame.notna() method to count the number of non-missing values.
import pandas as pd df = pd.DataFrame({ 'name': ['Alice', 'Bobby', None, None], 'experience': [None, 5, None, None], 'salary': [None, 180.2, 190.3, 205.4], }) # name experience salary # 0 Alice NaN NaN # 1 Bobby 5.0 180.2 # 2 None NaN 190.3 # 3 None NaN 205.4 print(df) print('-' * 50) # name 2 # experience 1 # salary 3 # dtype: int64 print(df.notna().sum())
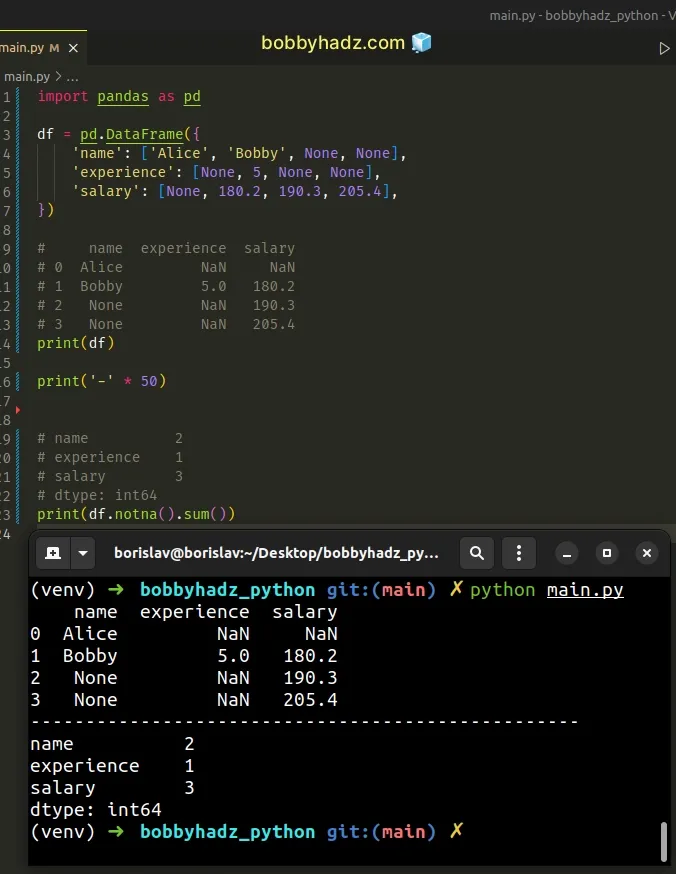
The
pandas.DataFrame.notna()
method detects the non-missing values in the DataFrame.
The method returns a DataFrame mask of boolean values for each element that
indicates whether an element is not an NA value.
import pandas as pd df = pd.DataFrame({ 'name': ['Alice', 'Bobby', None, None], 'experience': [None, 5, None, None], 'salary': [None, 180.2, 190.3, 205.4], }) # name experience salary # 0 Alice NaN NaN # 1 Bobby 5.0 180.2 # 2 None NaN 190.3 # 3 None NaN 205.4 print(df) print('-' * 50) # name experience salary # 0 True False False # 1 True True True # 2 False False True # 3 False False True print(df.notna())
You can call the sum() method on the result to get the count of the
non-missing values in each column.
# name 2 # experience 1 # salary 3 # dtype: int64 print(df.notna().sum())
You might also see the DataFrame.notnull() method being used.
import pandas as pd df = pd.DataFrame({ 'name': ['Alice', 'Bobby', None, None], 'experience': [None, 5, None, None], 'salary': [None, 180.2, 190.3, 205.4], }) # name experience salary # 0 Alice NaN NaN # 1 Bobby 5.0 180.2 # 2 None NaN 190.3 # 3 None NaN 205.4 print(df) print('-' * 50) # name 2 # experience 1 # salary 3 # dtype: int64 print(df.notnull().sum())
The DataFrame.notnull() method is an alias for the DataFrame.notna() method.
# Additional Resources
You can learn more about the related topics by checking out the following tutorials:
- How to replace None with NaN in Pandas DataFrame
- ValueError: cannot reindex on an axis with duplicate labels
- ValueError: Length mismatch: Expected axis has X elements, new values have Y elements
- ValueError: cannot reshape array of size X into shape Y
- Object arrays cannot be loaded when allow_pickle=False
- ValueError: Columns must be same length as key [Solved]
- ValueError: DataFrame constructor not properly called [Fix]
- TypeError: Field elements must be 2- or 3-tuples, got 1
- Add a column with incremental Numbers to a Pandas DataFrame
- Replace whole String if it contains Substring in Pandas
- ValueError: Cannot merge a Series without a name [Solved]
- Pandas: Changing the column type to Categorical
- Pandas: Get a List of Categories or Categorical Columns

