Pandas: How to Filter a DataFrame by value counts
Last updated: Apr 12, 2024
Reading time·4 min

# Table of Contents
- Pandas: How to Filter a DataFrame by value counts
- Pandas: How to Filter a DataFrame by value counts using transform()
- Pandas: How to Filter a DataFrame by value counts using DataFrame.map
# Pandas: How to Filter a DataFrame by value counts
To filter a Pandas DataFrame by value counts:
- Use the
groupby()method to group theDataFrameby the specific column. - Use the
filter()method to filter theDataFrameby value counts.
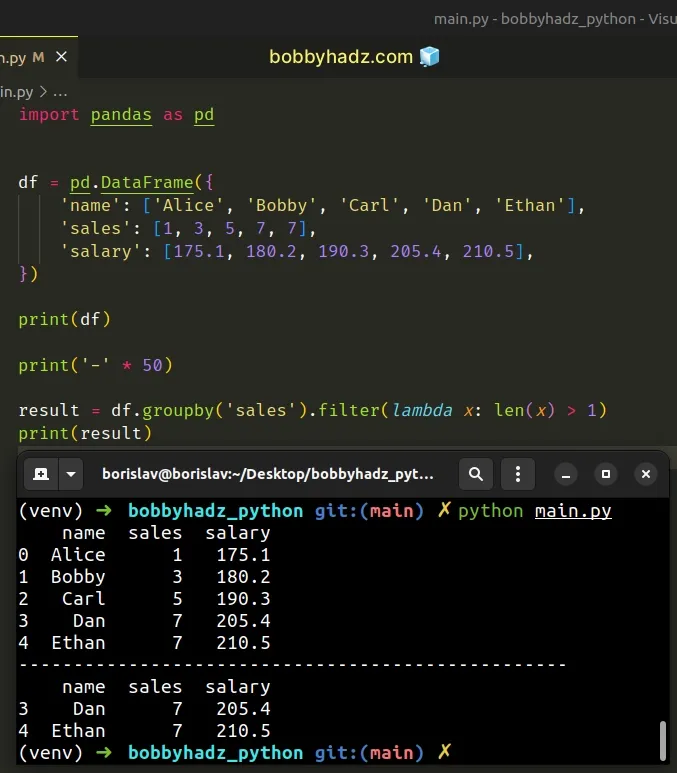
import pandas as pd df = pd.DataFrame({ 'name': ['Alice', 'Bobby', 'Carl', 'Dan', 'Ethan'], 'sales': [1, 3, 5, 7, 7], 'salary': [175.1, 180.2, 190.3, 205.4, 210.5], }) print(df) print('-' * 50) result = df.groupby('sales').filter(lambda x: len(x) > 1) print(result)
Running the code sample produces the following output.
name sales salary 0 Alice 1 175.1 1 Bobby 3 180.2 2 Carl 5 190.3 3 Dan 7 205.4 4 Ethan 7 210.5 -------------------------------------------------- name sales salary 3 Dan 7 205.4 4 Ethan 7 210.5
We used the
DataFrame.groupby()
method to group the DataFrame by the sales column.
result = df.groupby('sales').filter(lambda x: len(x) > 1)
The next step is to use the DataFrameGroupBy.filter() method to filter out the elements from the group that don't satisfy the condition.
Only values in the sales column that occur more than once get included in the
resulting DataFrame.
# Pandas: How to Filter a DataFrame by value counts using transform()
You can also use the
DataFrame.transform
method to filter a DataFrame by value counts.
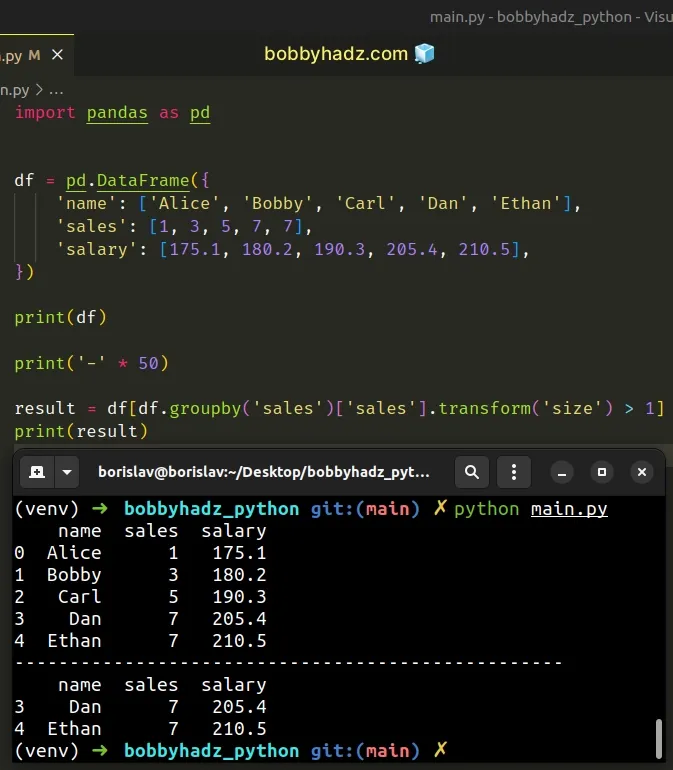
import pandas as pd df = pd.DataFrame({ 'name': ['Alice', 'Bobby', 'Carl', 'Dan', 'Ethan'], 'sales': [1, 3, 5, 7, 7], 'salary': [175.1, 180.2, 190.3, 205.4, 210.5], }) print(df) print('-' * 50) result = df[df.groupby('sales')['sales'].transform('size') > 1] print(result)
Running the code sample produces the following output.
name sales salary 0 Alice 1 175.1 1 Bobby 3 180.2 2 Carl 5 190.3 3 Dan 7 205.4 4 Ethan 7 210.5 -------------------------------------------------- name sales salary 3 Dan 7 205.4 4 Ethan 7 210.5
The DataFrame.transform() method calls the supplied function and produces a
DataFrame with the same axis shape as the DataFrame the method was called
on.
result = df[df.groupby('sales')['sales'].transform('size') > 1]
We used the size function to get an integer that represents the number of
elements in the object and compared it to 1.
# Pandas: How to Filter a DataFrame by value counts using DataFrame.map
You can also use the
DataFrame.map()
method to filter a DataFrame by value counts.
import pandas as pd df = pd.DataFrame({ 'name': ['Alice', 'Bobby', 'Carl', 'Dan', 'Ethan'], 'sales': [1, 3, 5, 7, 7], 'salary': [175.1, 180.2, 190.3, 205.4, 210.5], }) print(df) print('-' * 50) result = df[df['sales'].map(df['sales'].value_counts()) > 1] print(result)
Running the code sample produces the following output.
name sales salary 0 Alice 1 175.1 1 Bobby 3 180.2 2 Carl 5 190.3 3 Dan 7 205.4 4 Ethan 7 210.5 -------------------------------------------------- name sales salary 3 Dan 7 205.4 4 Ethan 7 210.5
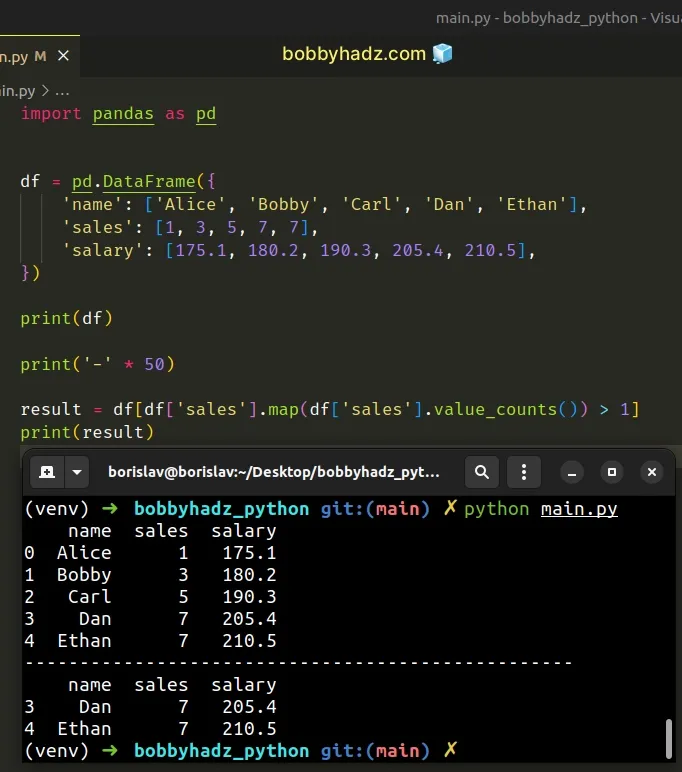
The DataFrame.map() method applies a function to a DataFrame element-wise.
result = df[df['sales'].map(df['sales'].value_counts()) > 1]
We used the
DataFrame.value_counts()
method to return a Series containing counts of unique rows in the DataFrame.
The same approach can be used if you need to add a column with the counts.
import pandas as pd df = pd.DataFrame({ 'name': ['Alice', 'Bobby', 'Carl', 'Dan', 'Ethan'], 'sales': [1, 3, 5, 7, 7], 'salary': [175.1, 180.2, 190.3, 205.4, 210.5], }) print(df) print('-' * 50) df['sales_count'] = df['sales'] df['sales_count'] = df['sales_count'].map(dict(df['sales'].value_counts())) print(df) print('-' * 50) print(df[df.sales_count > 1])
Running the code sample produces the following output.
name sales salary 0 Alice 1 175.1 1 Bobby 3 180.2 2 Carl 5 190.3 3 Dan 7 205.4 4 Ethan 7 210.5 -------------------------------------------------- name sales salary sales_count 0 Alice 1 175.1 1 1 Bobby 3 180.2 1 2 Carl 5 190.3 1 3 Dan 7 205.4 2 4 Ethan 7 210.5 2 -------------------------------------------------- name sales salary sales_count 3 Dan 7 205.4 2 4 Ethan 7 210.5 2
The new sales_count column stores the value counts for the sales column.
I've also written articles on:
- Pandas: Find the percentage of Missing values in each Column
- Pandas: Find common Rows (intersection) between 2 DataFrames
- Pandas: Find first and last non-NaN values in a DataFrame
- Filter rows in a Pandas DataFrame using Regex
# Additional Resources
You can learn more about the related topics by checking out the following tutorials:
- Cannot subset columns with tuple with more than one element
- Pandas: Get Nth row or every Nth row in a DataFrame
- Pandas: Describe not showing all columns in DataFrame [Fix]
- Pandas: Convert entire DataFrame to numeric (int or float)
- Pandas: Select Rows between two values in DataFrame
- Pandas: Get the Rows that are NOT in another DataFrame
- How to Transpose a Pandas DataFrame without index
- Pandas: Element-wise logical NOT and logical OR operators
- Update a Pandas DataFrame while iterating over its rows
- NumPy: Get the indices of the N largest values in an Array
- Pandas TypeError: no numeric data to plot [Solved]
- ValueError: If using all scalar values, you must pass index
- How to add a Filter to Pivot Table in Pandas
- Pandas: Remove special characters from Column Values/Names
- Pandas: Count the unique combinations of two Columns
- Pandas: How to Query a Column name with Spaces
- Annotate Bars in Barplot with Pandas and Matplotlib
- Pandas: Create a Tuple from two DataFrame Columns
- Disable the TOKENIZERS_PARALLELISM=(true | false) warning
- RuntimeError: Expected scalar type Float but found Double
- Pandas: Convert timezone-aware DateTimeIndex to naive timestamp
- RuntimeError: Input type (torch.FloatTensor) and weight type (torch.cuda.FloatTensor) should be the same
- How to read a .mat (Matplotlib) file in Python
- Python: How to center the Title in Plotly
- ValueError: Expected object or value with
pd.read_json() - Mixing dicts with non-Series may lead to ambiguous ordering