Pandas: Describe not showing all columns in DataFrame [Fix]
Last updated: Apr 12, 2024
Reading time·4 min

# Table of Contents
# Pandas: Describe not showing all columns in DataFrame
If not all DataFrame columns are displayed when calling describe(), set
the include argument to "all".
When the include argument is set to "all", all columns of the DataFrame
will be included in the output.
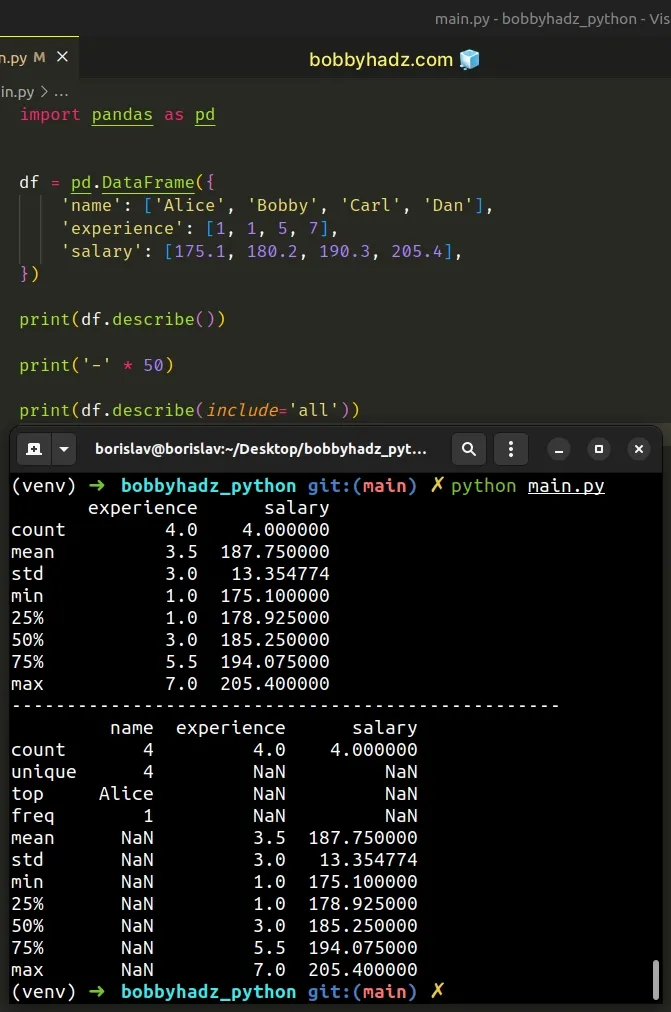
import pandas as pd df = pd.DataFrame({ 'name': ['Alice', 'Bobby', 'Carl', 'Dan'], 'experience': [1, 1, 5, 7], 'salary': [175.1, 180.2, 190.3, 205.4], }) print(df.describe()) print('-' * 50) print(df.describe(include='all'))
Running the code sample produces the following output.
experience salary count 4.0 4.000000 mean 3.5 187.750000 std 3.0 13.354774 min 1.0 175.100000 25% 1.0 178.925000 50% 3.0 185.250000 75% 5.5 194.075000 max 7.0 205.400000 -------------------------------------------------- name experience salary count 4 4.0 4.000000 unique 4 NaN NaN top Alice NaN NaN freq 1 NaN NaN mean NaN 3.5 187.750000 std NaN 3.0 13.354774 min NaN 1.0 175.100000 25% NaN 1.0 178.925000 50% NaN 3.0 185.250000 75% NaN 5.5 194.075000 max NaN 7.0 205.400000

The
DataFrame.describe
method generates descriptive statistics, including ones that summarize the
central tendency, dispersion and shape of a dataset's distribution (excluding
NaN values).
By default, the method only provides a summary for numeric columns, however,
this behavior can be changed by setting the include parameter to "all".
print(df.describe(include='all'))
When the include parameter is set to "all", all columns of the DataFrame
are included in the output.
By default, the include parameter is set to None, which means that the
result will include only the numeric columns.
You can also call the describe() method on a specific column.
import pandas as pd df = pd.DataFrame({ 'name': ['Alice', 'Bobby', 'Carl', 'Dan'], 'experience': [1, 1, 5, 7], 'salary': [175.1, 180.2, 190.3, 205.4], }) # count 4.000000 # mean 187.750000 # std 13.354774 # min 175.100000 # 25% 178.925000 # 50% 185.250000 # 75% 194.075000 # max 205.400000 # Name: salary, dtype: float64 print(df['salary'].describe())
Or include only the columns that have a specific type (e.g. the numeric ones).
import pandas as pd import numpy as np df = pd.DataFrame({ 'name': ['Alice', 'Bobby', 'Carl', 'Dan'], 'experience': [1, 1, 5, 7], 'salary': [175.1, 180.2, 190.3, 205.4], }) # experience salary # count 4.0 4.000000 # mean 3.5 187.750000 # std 3.0 13.354774 # min 1.0 175.100000 # 25% 1.0 178.925000 # 50% 3.0 185.250000 # 75% 5.5 194.075000 # max 7.0 205.400000 print(df.describe(include=[np.number]))
The code sample only includes the numeric columns in the DataFrame
description.
# Set the display.max_columns option to None
If you still don't see all DataFrame columns, set the display.max_columns
option to None to set the max columns option to unlimited.
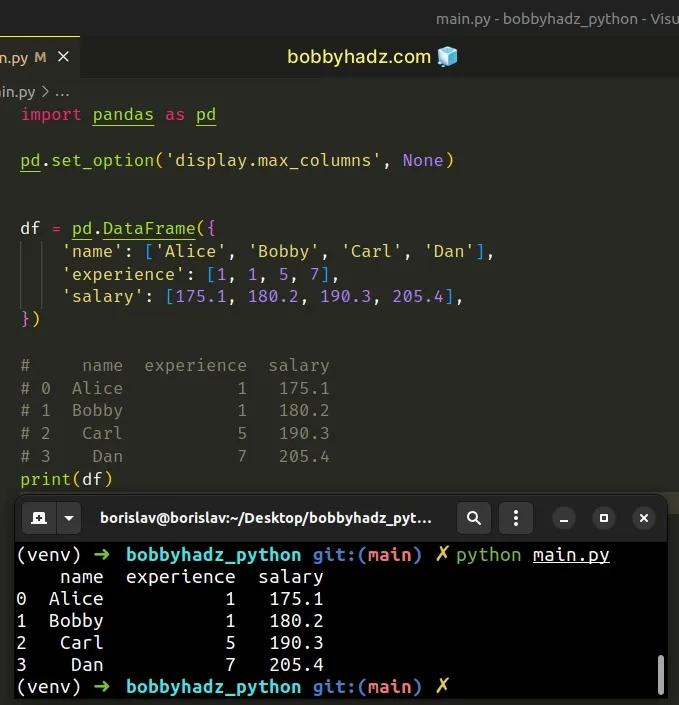
import pandas as pd pd.set_option('display.max_columns', None) df = pd.DataFrame({ 'name': ['Alice', 'Bobby', 'Carl', 'Dan'], 'experience': [1, 1, 5, 7], 'salary': [175.1, 180.2, 190.3, 205.4], }) # name experience salary # 0 Alice 1 175.1 # 1 Bobby 1 180.2 # 2 Carl 5 190.3 # 3 Dan 7 205.4 print(df)

If the max_cols option is exceeded, then Pandas switches to truncate view,
which might not be what you want.
If Python or IPython is running in a terminal, the max_columns option can be
set to None for Pandas to auto-detect the width of the terminal and print a
truncated object which fits the screen width.
If you need to call the DataFrame.describe() method, call it after setting the
max_columns option.
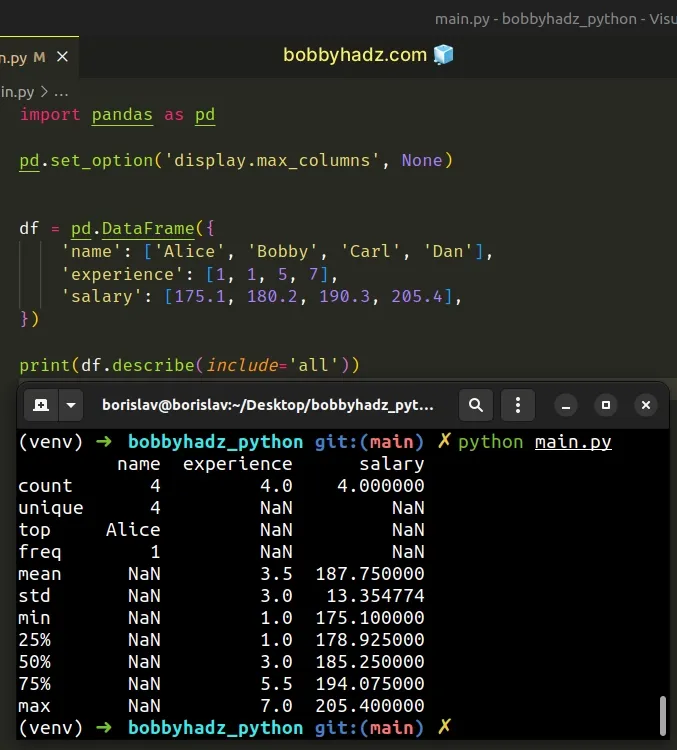
import pandas as pd pd.set_option('display.max_columns', None) df = pd.DataFrame({ 'name': ['Alice', 'Bobby', 'Carl', 'Dan'], 'experience': [1, 1, 5, 7], 'salary': [175.1, 180.2, 190.3, 205.4], }) # name experience salary # count 4 4.0 4.000000 # unique 4 NaN NaN # top Alice NaN NaN # freq 1 NaN NaN # mean NaN 3.5 187.750000 # std NaN 3.0 13.354774 # min NaN 1.0 175.100000 # 25% NaN 1.0 178.925000 # 50% NaN 3.0 185.250000 # 75% NaN 5.5 194.075000 # max NaN 7.0 205.400000 print(df.describe(include='all'))

You can also use the with statement syntax.
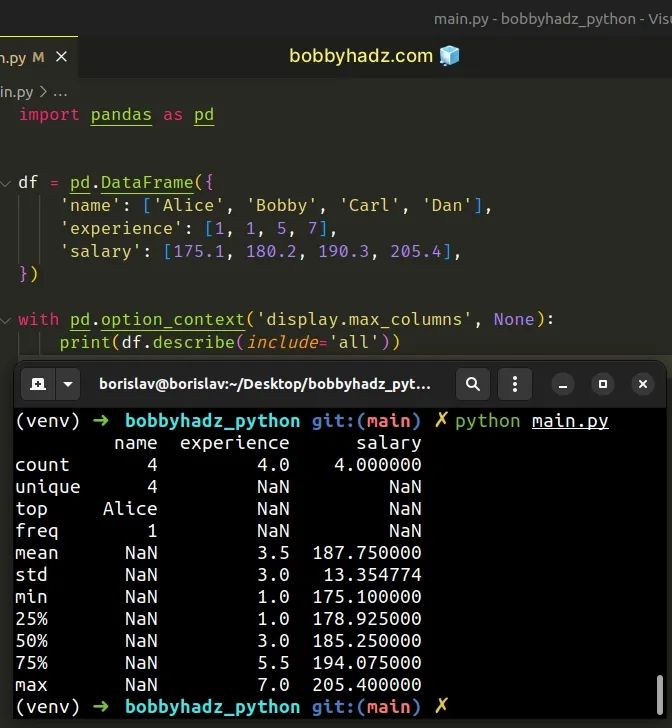
import pandas as pd df = pd.DataFrame({ 'name': ['Alice', 'Bobby', 'Carl', 'Dan'], 'experience': [1, 1, 5, 7], 'salary': [175.1, 180.2, 190.3, 205.4], }) with pd.option_context('display.max_columns', None): print(df.describe(include='all'))
Running the code sample produces the following output.
name experience salary count 4 4.0 4.000000 unique 4 NaN NaN top Alice NaN NaN freq 1 NaN NaN mean NaN 3.5 187.750000 std NaN 3.0 13.354774 min NaN 1.0 175.100000 25% NaN 1.0 178.925000 50% NaN 3.0 185.250000 75% NaN 5.5 194.075000 max NaN 7.0 205.400000

When using the with syntax, the option is only set in the indented with
block.
Once you exit the with block, the option is no longer set.
# Additional Resources
You can learn more about the related topics by checking out the following tutorials:
- Pandas: Strip whitespace from Column Headers in DataFrame
- NumPy or Pandas: How to check a Value or an Array for NaT
- How to repeat Rows N times in a Pandas DataFrame
- How to convert a Pandas DataFrame to a Markdown Table
- Pandas: How to get the Max and Min Dates in a DataFrame
- Pandas: Select first N or last N columns of DataFrame
- Pandas: Convert entire DataFrame to numeric (int or float)
- Pandas: Find common Rows (intersection) between 2 DataFrames
- Pandas: How to Filter a DataFrame by value counts
- Pandas: Get the Rows that are NOT in another DataFrame
- How to Transpose a Pandas DataFrame without index
- Pandas: Element-wise logical NOT and logical OR operators
- Update a Pandas DataFrame while iterating over its rows
- Pandas: GroupBy columns with NaN (missing) values
- Pandas: How to keep the Index when merging DataFrames
- Pandas: Merge only specific DataFrame columns
- How to modify a Subset of Rows in a Pandas DataFrame
- How to Start the Index of a Pandas DataFrame at 1
- Pandas: DataFrame.reset_index() not working [Solved]
- How to Add Axis Labels to a Plot in Pandas [5 Ways]
- How to Create a Set from a Series in Pandas

