How to convert a Pandas DataFrame to a Markdown Table
Last updated: Apr 12, 2024
Reading time·5 min

# Table of Contents
- How to convert a Pandas DataFrame to a Markdown Table
- Converting the DataFrame to a Markdown table and writing the result to a file
- Convert a Pandas DataFrame to a Markdown Table using tabulate
# How to convert a Pandas DataFrame to a Markdown Table
Use the DataFrame.to_markdown() method to convert a Pandas DataFrame to a
markdown table.
The method returns the DataFrame in a markdown-friendly format, as a
string.
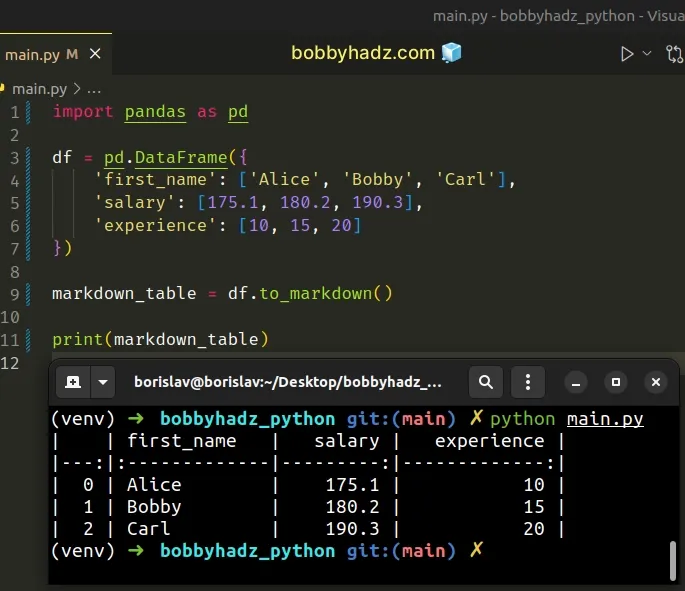
import pandas as pd df = pd.DataFrame({ 'first_name': ['Alice', 'Bobby', 'Carl'], 'salary': [175.1, 180.2, 190.3], 'experience': [10, 15, 20] }) markdown_table = df.to_markdown() print(markdown_table)
Running the code sample produces the following output.
| | first_name | salary | experience | |---:|:-------------|---------:|-------------:| | 0 | Alice | 175.1 | 10 | | 1 | Bobby | 180.2 | 15 | | 2 | Carl | 190.3 | 20 |
If you get an error when running the code sample, make sure you
have the tabulate package installed.
pip install pandas tabulate # or with pip3 pip3 install pandas tabulate
The
DataFrame.to_markdown()
method converts the DataFrame to a markdown object and returns the result as a
string.
Notice that the output also contains the index column.
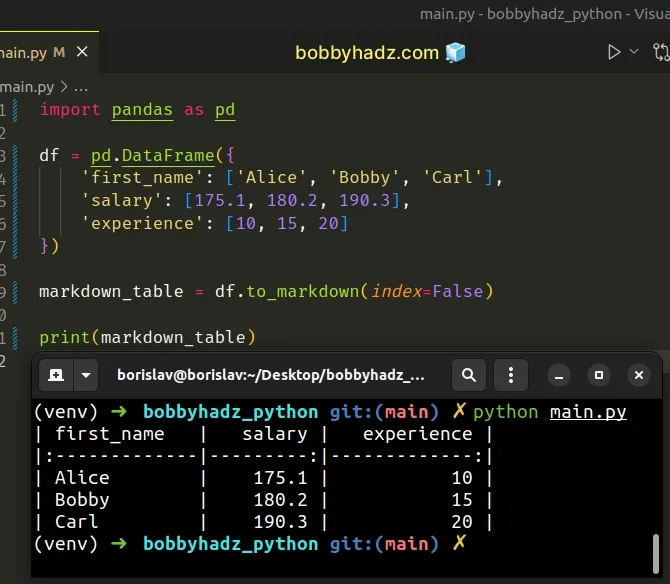
If you want to exclude the column, set the index argument to False when
calling to_markdown().
import pandas as pd df = pd.DataFrame({ 'first_name': ['Alice', 'Bobby', 'Carl'], 'salary': [175.1, 180.2, 190.3], 'experience': [10, 15, 20] }) markdown_table = df.to_markdown(index=False) print(markdown_table)
Running the code sample produces the following output.
| first_name | salary | experience | |:-------------|---------:|-------------:| | Alice | 175.1 | 10 | | Bobby | 180.2 | 15 | | Carl | 190.3 | 20 |
If you use a Pandas version of less than 1.1, you would have to set the
showindex argument to False instead of index.
markdown_table = df.to_markdown(showindex=False)
You can print your pandas version with the pip show pandas command.
pip show pandas pip3 show pandas
The pandas package uses the
tabulate module under the hook, so
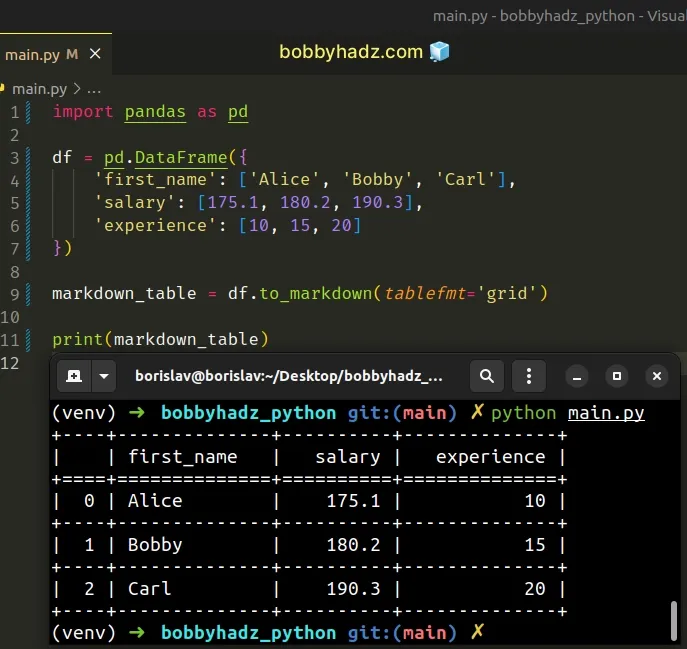
you can pass tabulate parameters to the to_markdown() method.
import pandas as pd df = pd.DataFrame({ 'first_name': ['Alice', 'Bobby', 'Carl'], 'salary': [175.1, 180.2, 190.3], 'experience': [10, 15, 20] }) markdown_table = df.to_markdown(tablefmt='grid') print(markdown_table)
Running the code sample produces the following output.
+----+--------------+----------+--------------+ | | first_name | salary | experience | +====+==============+==========+==============+ | 0 | Alice | 175.1 | 10 | +----+--------------+----------+--------------+ | 1 | Bobby | 180.2 | 15 | +----+--------------+----------+--------------+ | 2 | Carl | 190.3 | 20 | +----+--------------+----------+--------------+
# Converting the DataFrame to a Markdown table and writing the result to a file
You can use the with open() statement to write the markdown table to a file after the conversion.
import pandas as pd df = pd.DataFrame({ 'first_name': ['Alice', 'Bobby', 'Carl'], 'salary': [175.1, 180.2, 190.3], 'experience': [10, 15, 20] }) markdown_table = df.to_markdown(index=False) file_path = 'example.md' with open(file_path, 'w', encoding='utf-8') as md_file: md_file.write(markdown_table) print('Markdown table written to file.')
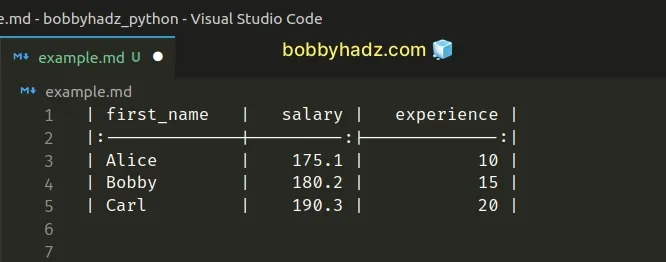
The code sample produces the following example.md file in the same directory
as the main.py script.
# Convert a Pandas DataFrame to a Markdown Table using tabulate
Alternatively, you can use the tabulate module directly.
First, make sure you have the module installed.
Open your terminal in your project's root directory and run the following command.
pip install pandas tabulate # or with pip3 pip3 install pandas tabulate
Now import and use the module as follows.
import pandas as pd from tabulate import tabulate df = pd.DataFrame({ 'first_name': ['Alice', 'Bobby', 'Carl'], 'salary': [175.1, 180.2, 190.3], 'experience': [10, 15, 20] }) markdown_table = tabulate( df, tablefmt='pipe', headers='keys', showindex=False ) print(markdown_table)
Running the code sample produces the following output.
| first_name | salary | experience | |:-------------|---------:|-------------:| | Alice | 175.1 | 10 | | Bobby | 180.2 | 15 | | Carl | 190.3 | 20 |
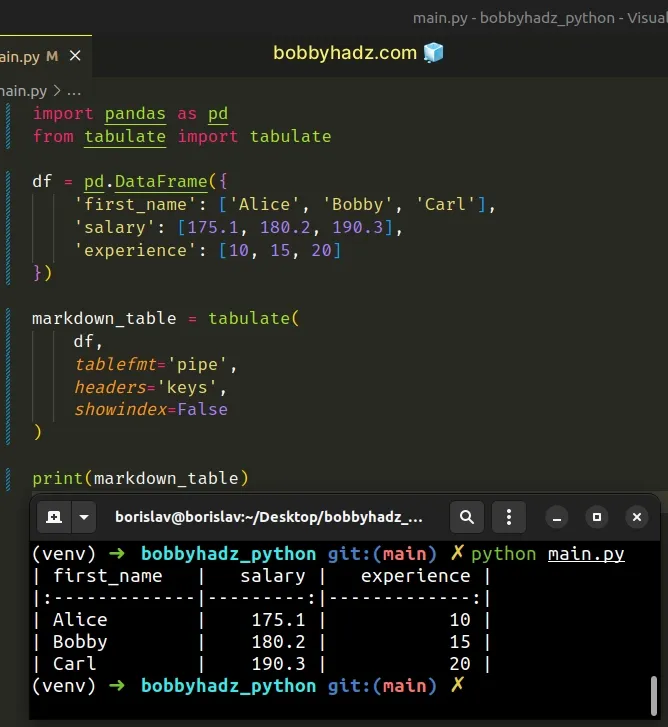
You can pass different arguments to the tabulate method depending on how you
want the markdown table to be formatted.
You can view all of the arguments the method takes on the package's GitHub page.
Here are some examples that you different formatting options.
The following code sample sets the tablefmt argument to "plain".
import pandas as pd from tabulate import tabulate df = pd.DataFrame({ 'first_name': ['Alice', 'Bobby', 'Carl'], 'salary': [175.1, 180.2, 190.3], 'experience': [10, 15, 20] }) markdown_table = tabulate( df, tablefmt='plain', headers='keys', showindex=False ) print(markdown_table)
The following output is produced.
first_name salary experience Alice 175.1 10 Bobby 180.2 15 Carl 190.3 20
You can also set the tablefmt argument to "simple".
import pandas as pd from tabulate import tabulate df = pd.DataFrame({ 'first_name': ['Alice', 'Bobby', 'Carl'], 'salary': [175.1, 180.2, 190.3], 'experience': [10, 15, 20] }) markdown_table = tabulate( df, tablefmt='simple', headers='keys', showindex=False ) # first_name salary experience # ------------ -------- ------------ # Alice 175.1 10 # Bobby 180.2 15 # Carl 190.3 20 print(markdown_table)
The argument can also be set to "github" to use the GitHub markdown formatting
style.
import pandas as pd from tabulate import tabulate df = pd.DataFrame({ 'first_name': ['Alice', 'Bobby', 'Carl'], 'salary': [175.1, 180.2, 190.3], 'experience': [10, 15, 20] }) markdown_table = tabulate( df, tablefmt='github', headers='keys', showindex=False ) # | first_name | salary | experience | # |--------------|----------|--------------| # | Alice | 175.1 | 10 | # | Bobby | 180.2 | 15 | # | Carl | 190.3 | 20 | print(markdown_table)
The other popular format is "grid".
import pandas as pd from tabulate import tabulate df = pd.DataFrame({ 'first_name': ['Alice', 'Bobby', 'Carl'], 'salary': [175.1, 180.2, 190.3], 'experience': [10, 15, 20] }) markdown_table = tabulate( df, tablefmt='grid', headers='keys', showindex=False ) # +--------------+----------+--------------+ # | first_name | salary | experience | # +==============+==========+==============+ # | Alice | 175.1 | 10 | # +--------------+----------+--------------+ # | Bobby | 180.2 | 15 | # +--------------+----------+--------------+ # | Carl | 190.3 | 20 | # +--------------+----------+--------------+ print(markdown_table)
There is also a "heavy_grid" option.
import pandas as pd from tabulate import tabulate df = pd.DataFrame({ 'first_name': ['Alice', 'Bobby', 'Carl'], 'salary': [175.1, 180.2, 190.3], 'experience': [10, 15, 20] }) markdown_table = tabulate( df, tablefmt='heavy_grid', headers='keys', showindex=False ) # ┏━━━━━━━━━━━━━━┳━━━━━━━━━━┳━━━━━━━━━━━━━━┓ # ┃ first_name ┃ salary ┃ experience ┃ # ┣━━━━━━━━━━━━━━╋━━━━━━━━━━╋━━━━━━━━━━━━━━┫ # ┃ Alice ┃ 175.1 ┃ 10 ┃ # ┣━━━━━━━━━━━━━━╋━━━━━━━━━━╋━━━━━━━━━━━━━━┫ # ┃ Bobby ┃ 180.2 ┃ 15 ┃ # ┣━━━━━━━━━━━━━━╋━━━━━━━━━━╋━━━━━━━━━━━━━━┫ # ┃ Carl ┃ 190.3 ┃ 20 ┃ # ┗━━━━━━━━━━━━━━┻━━━━━━━━━━┻━━━━━━━━━━━━━━┛ print(markdown_table)
Or even "rounded_grid" to round the table's borders.
import pandas as pd from tabulate import tabulate df = pd.DataFrame({ 'first_name': ['Alice', 'Bobby', 'Carl'], 'salary': [175.1, 180.2, 190.3], 'experience': [10, 15, 20] }) markdown_table = tabulate( df, tablefmt='rounded_grid', headers='keys', showindex=False ) # ╭──────────────┬──────────┬──────────────╮ # │ first_name │ salary │ experience │ # ├──────────────┼──────────┼──────────────┤ # │ Alice │ 175.1 │ 10 │ # ├──────────────┼──────────┼──────────────┤ # │ Bobby │ 180.2 │ 15 │ # ├──────────────┼──────────┼──────────────┤ # │ Carl │ 190.3 │ 20 │ # ╰──────────────┴──────────┴──────────────╯ print(markdown_table)
You can view all of the other available grid formats in this section of the docs.
# Additional Resources
You can learn more about the related topics by checking out the following tutorials:
- Pandas: Sum the values in a Column that match a Condition
- Pandas: Make new Column from string Slice of another Column
- Pandas: Calculate mean (average) across multiple DataFrames
- NumPy or Pandas: How to check a Value or an Array for NaT
- Interpolating NaN values in a NumPy Array in Python
- Pandas ValueError: ('Lengths must match to compare')
- How to repeat Rows N times in a Pandas DataFrame
- Pandas: Convert GroupBy results to Dictionary of Lists
- Pandas: How to get the Max and Min Dates in a DataFrame
- Reduction operation 'argmax' not allowed for this dtype
- ValueError: Grouper for 'X' not 1-dimensional [Solved]
- Cannot subset columns with tuple with more than one element
- NumPy: Get the indices of the N largest values in an Array
- Pandas: How to keep the Index when merging DataFrames
- How to Start the Index of a Pandas DataFrame at 1
- Pandas: DataFrame.reset_index() not working [Solved]
- How to Add Axis Labels to a Plot in Pandas [5 Ways]
- How to Create a Set from a Series in Pandas

