Pandas: Create Scatter plot from multiple DataFrame columns
Last updated: Apr 12, 2024
Reading time·4 min

# Table of Contents
- Pandas: Create Scatter plot from multiple DataFrame columns
- Setting the names of the labels
- Pandas: Create Scatter plot from multiple DataFrame columns using a for loop
# Pandas: Create Scatter plot from multiple DataFrame columns
Set the ax argument when calling DataFrame.plot() to create a scatter plot
from multiple DataFrame columns in Pandas.
The ax argument enables us to set the axes of the current figure.
import pandas as pd import matplotlib.pyplot as plt df = pd.DataFrame( [[1.038988, 1.15915721, -2.28067047, 2.15586249], [1.67701311, -0.29835294, 1.85995237, 0.09892021], [-1.27494246, -1.10266464, -0.53293884, 0.65932129], [1.57701142, -0.75032143, 1.06973893, 0.82543657], [-0.99777099, -0.46051326, 1.43704249, 1.24864683], [-0.73344725, 1.63418558, 0.7973022, -1.9192436] ], columns=['A', 'B', 'C', 'D'] ) ax1 = df.plot(kind='scatter', x='A', y='B', color='g') ax2 = df.plot(kind='scatter', x='C', y='D', color='r', ax=ax1) plt.show()
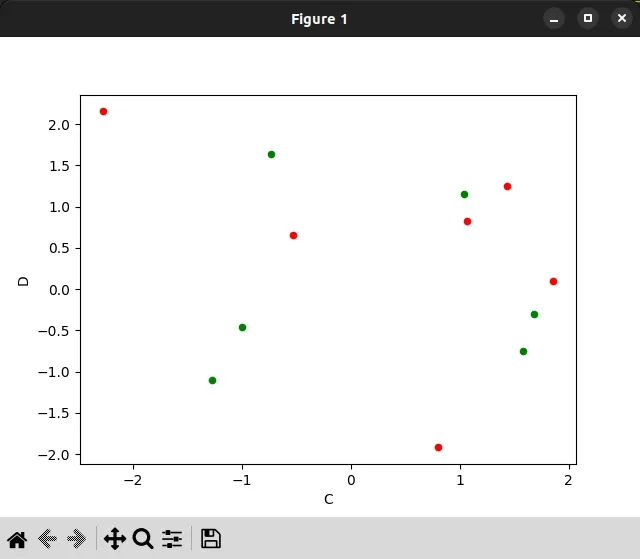
The
DataFrame.plot()
method makes plots of a DataFrame.
ax1 = df.plot(kind='scatter', x='A', y='B', color='g') ax2 = df.plot(kind='scatter', x='C', y='D', color='r', ax=ax1)
We passed the following arguments to the method:
kind- the kind of plot to produce.x- the label along thexaxis.y- the label along theyaxis.color- the marker colors.ax- theaxesof the current figure.
The ax argument determines the axes the plot is drawn into.
If you don't supply the a argument, the DataFrame.plot() method creates a
new plot and axes.
Notice that we didn't pass an ax argument in the first call to plot().
ax1 = df.plot(kind='scatter', x='A', y='B', color='g') ax2 = df.plot(kind='scatter', x='C', y='D', color='r', ax=ax1)
Instead, we used the produced from the first call axes as the ax argument in
the second call.
If you have multiple calls to the DataFrame.plot() method, you would still
reuse the same value for the ax argument.
ax1 = df.plot(kind='scatter', x='A', y='B', color='g') ax2 = df.plot(kind='scatter', x='C', y='D', color='r', ax=ax1) ax3 = df.plot(kind='scatter', x='E', y='F', color='b', ax=ax1)
To create a scatter plot using multiple DataFrame columns, the ax argument
in the subsequent DataFrame calls has to be the same (ax1).
You can verify that this is the case by comparing the axes that are returned
from DataFrame.plot().
import pandas as pd import matplotlib.pyplot as plt df = pd.DataFrame( [[1.038988, 1.15915721, -2.28067047, 2.15586249], [1.67701311, -0.29835294, 1.85995237, 0.09892021], [-1.27494246, -1.10266464, -0.53293884, 0.65932129], [1.57701142, -0.75032143, 1.06973893, 0.82543657], [-0.99777099, -0.46051326, 1.43704249, 1.24864683], [-0.73344725, 1.63418558, 0.7973022, -1.9192436] ], columns=['A', 'B', 'C', 'D'] ) ax1 = df.plot(kind='scatter', x='A', y='B', color='g') ax2 = df.plot(kind='scatter', x='C', y='D', color='r', ax=ax1) print(ax1 == ax2) # 👉️ True plt.show()
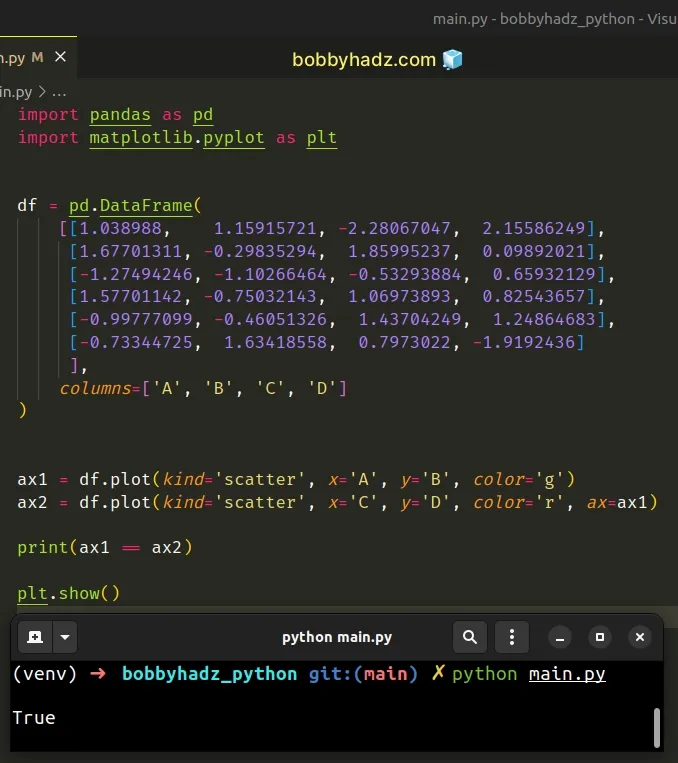
The equality comparison will return True if the ax argument is supplied
correctly.
# Setting the names of the labels
You can also set the names of the labels when calling DataFrame.plot().
import pandas as pd import matplotlib.pyplot as plt df = pd.DataFrame( [[1.038988, 1.15915721, -2.28067047, 2.15586249], [1.67701311, -0.29835294, 1.85995237, 0.09892021], [-1.27494246, -1.10266464, -0.53293884, 0.65932129], [1.57701142, -0.75032143, 1.06973893, 0.82543657], [-0.99777099, -0.46051326, 1.43704249, 1.24864683], [-0.73344725, 1.63418558, 0.7973022, -1.9192436] ], columns=['A', 'B', 'C', 'D'] ) ax1 = df.plot( kind='scatter', x='A', y='B', color='g', label='First' ) ax2 = df.plot( kind='scatter', x='C', y='D', color='r', ax=ax1, label='Second' ) plt.show()
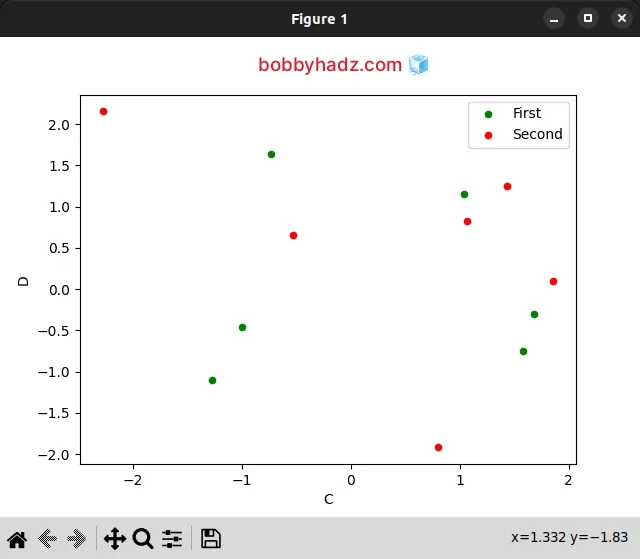
If you need to
add axis labels to the plot, call the
set_xlabel() and set_ylabel() methods on ax1.
import pandas as pd import matplotlib.pyplot as plt df = pd.DataFrame( [[1.038988, 1.15915721, -2.28067047, 2.15586249], [1.67701311, -0.29835294, 1.85995237, 0.09892021], [-1.27494246, -1.10266464, -0.53293884, 0.65932129], [1.57701142, -0.75032143, 1.06973893, 0.82543657], [-0.99777099, -0.46051326, 1.43704249, 1.24864683], [-0.73344725, 1.63418558, 0.7973022, -1.9192436] ], columns=['A', 'B', 'C', 'D'] ) ax1 = df.plot( kind='scatter', x='A', y='B', color='g', label='First' ) ax2 = df.plot( kind='scatter', x='C', y='D', color='r', ax=ax1, label='Second' ) ax1.set_xlabel('horizontal label') ax1.set_ylabel('vertial label') plt.show()
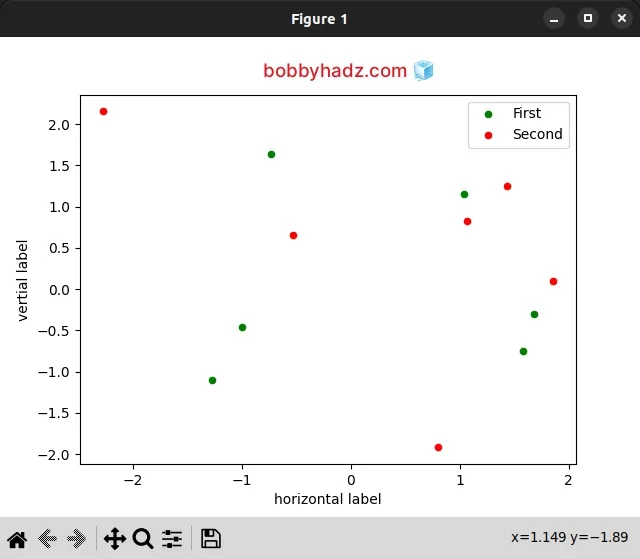
I've written a detailed guide on how to add axis labels to a plot in Pandas.
# Pandas: Create Scatter plot from multiple DataFrame columns using a for loop
You can also use a for loop if you want to make your code more concise and reusable.
import pandas as pd import matplotlib.pyplot as plt df = pd.DataFrame( [[1.038988, 1.15915721, -2.28067047, 2.15586249], [1.67701311, -0.29835294, 1.85995237, 0.09892021], [-1.27494246, -1.10266464, -0.53293884, 0.65932129], [1.57701142, -0.75032143, 1.06973893, 0.82543657], [-0.99777099, -0.46051326, 1.43704249, 1.24864683], [-0.73344725, 1.63418558, 0.7973022, -1.9192436] ], columns=['A', 'B', 'C', 'D'] ) f, ax = plt.subplots(1) for x, y, color in zip(['A', 'C'], ['B', 'D'], ['g', 'r']): df.plot( kind='scatter', x=x, y=y, color=color, ax=ax, label=f'{x} vs {y}' ) ax.set_xlabel('horizontal label') ax.set_ylabel('vertial label') plt.show()
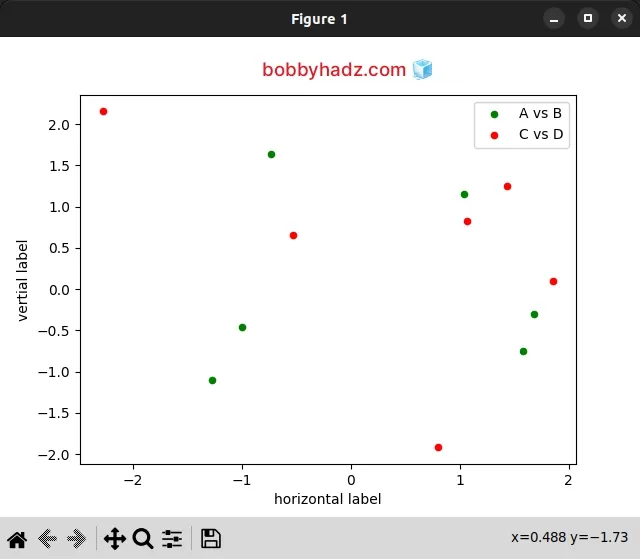
The zip() function iterates over several iterables in parallel and produces tuples with an item from each iterable.
# [('A', 'B', 'g'), ('C', 'D', 'r')] print(list(zip(['A', 'C'], ['B', 'D'], ['g', 'r'])))
On each iteration of the for loop, we call the DataFrame.plot() method.
The matplotlib.pyplot.subplots() method creates a figure and a set of
subplots.
f, ax = plt.subplots(1)
Notice that the ax argument gets set to the same axes on each iteration.
for x, y, color in zip(['A', 'C'], ['B', 'D'], ['g', 'r']): df.plot( kind='scatter', x=x, y=y, color=color, ax=ax, label=f'{x} vs {y}' )
The three lists we passed to the zip function are:
- The values for the
xargument in theDataFrame.plot()calls. - The values for the
yargument. - The values for the
colorargument.
# Additional Resources
You can learn more about the related topics by checking out the following tutorials:

