Pandas: How to Convert a Pivot Table to a DataFrame
Last updated: Apr 12, 2024
Reading time·4 min

# Table of Contents
- Pandas: How to Convert a Pivot Table to a DataFrame
- Convert a Pivot Table to a DataFrame using rename_axis()
- Convert a Pivot Table to a DataFrame using to_records()
# Pandas: How to Convert a Pivot Table to a DataFrame
To convert a pivot table to a DataFrame in Pandas:
- Set the
columns.nameproperty toNoneto remove the column name. - Use the
reset_index()method to convert the index to columns.
import pandas as pd df = pd.DataFrame({ 'id': [1, 1, 2, 2, 3, 3], 'name': ['Alice', 'Alice', 'Bobby', 'Bobby', 'Carl', 'Dan'], 'experience': [1, 2, 2, 3, 3, 8], }) table = df.pivot_table( index='id', columns=['name'], values='experience', aggfunc='mean', fill_value=0 ) new_df = table new_df.columns.name = None new_df.reset_index() print(new_df)
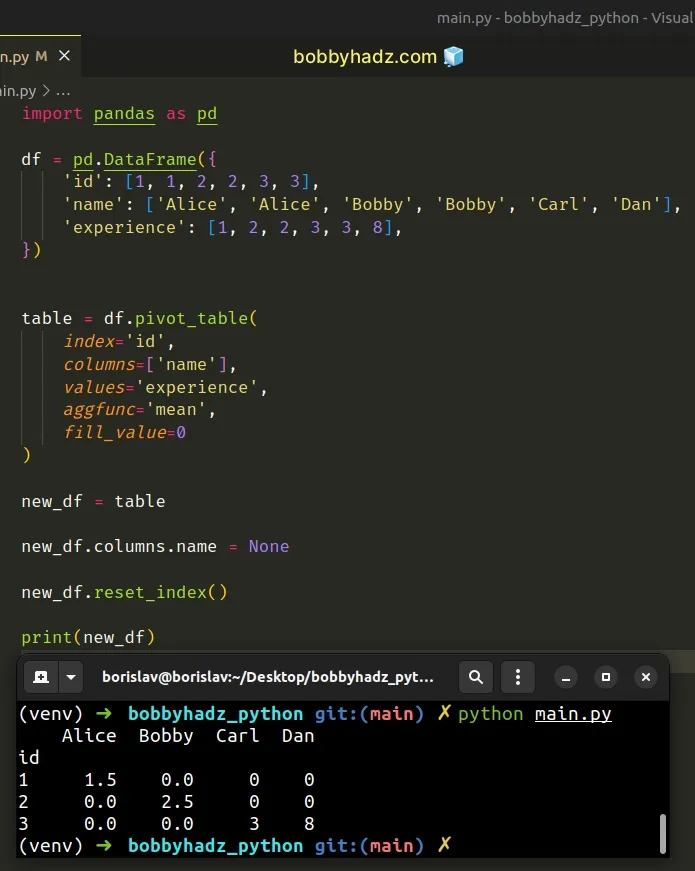
We first set the columns.name property to None to remove the column name and
then used the
DataFrame.reset_index() method
to convert the index to columns.
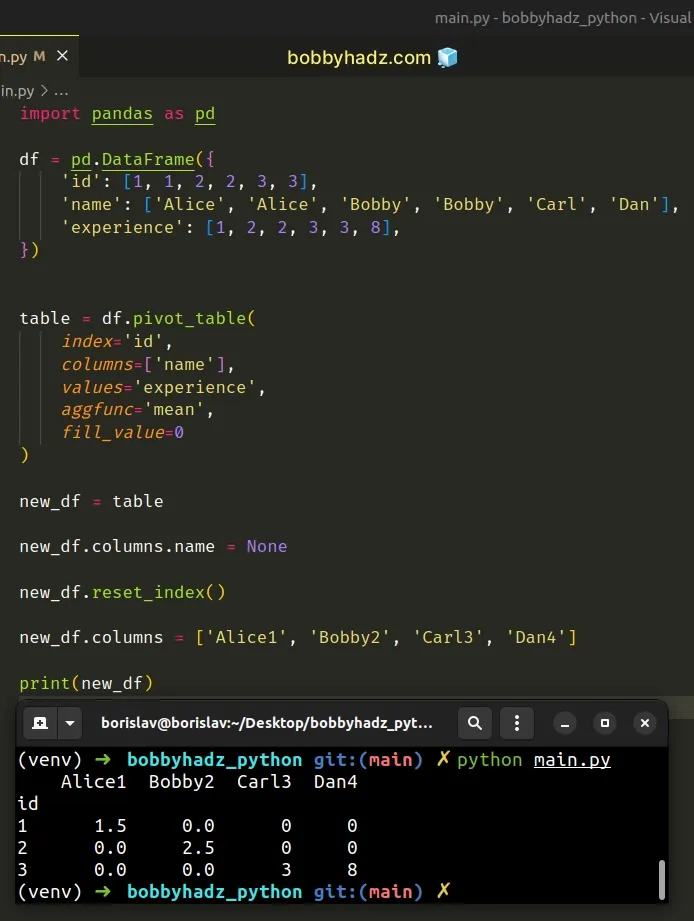
If you need to rename the columns in the new DataFrame, set the columns
attribute to a list of column names.
import pandas as pd df = pd.DataFrame({ 'id': [1, 1, 2, 2, 3, 3], 'name': ['Alice', 'Alice', 'Bobby', 'Bobby', 'Carl', 'Dan'], 'experience': [1, 2, 2, 3, 3, 8], }) table = df.pivot_table( index='id', columns=['name'], values='experience', aggfunc='mean', fill_value=0 ) new_df = table new_df.columns.name = None new_df.reset_index() # Alice Bobby Carl Dan # id # 1 1.5 0.0 0 0 # 2 0.0 2.5 0 0 # 3 0.0 0.0 3 8 print(new_df) new_df.columns = ['Alice1', 'Bobby2', 'Carl3', 'Dan4'] print('-' * 50) # Alice1 Bobby2 Carl3 Dan4 # id # 1 1.5 0.0 0 0 # 2 0.0 2.5 0 0 # 3 0.0 0.0 3 8 print(new_df)
Note: if you've created a MultiIndex
DataFrame, you will have to use the DataFrame.droplevel() method before callingreset_index().
new_df = table new_df.columns = new_df.columns.droplevel(0) new_df.columns.name = None new_df = new_df.reset_index()
# Convert a Pivot Table to a DataFrame using rename_axis()
You can also use the DataFrame.rename_axis() method to set the name of the column axis after resetting the index.
import pandas as pd df = pd.DataFrame({ 'id': [1, 1, 2, 2, 3, 3], 'name': ['Alice', 'Alice', 'Bobby', 'Bobby', 'Carl', 'Dan'], 'experience': [1, 2, 2, 3, 3, 8], }) table = df.pivot_table( index='id', columns=['name'], values='experience', aggfunc='mean', fill_value=0 ) new_df = table new_df = new_df.reset_index().rename_axis(None, axis=1) # id Alice Bobby Carl Dan # 0 1 1.5 0.0 0 0 # 1 2 0.0 2.5 0 0 # 2 3 0.0 0.0 3 8 print(new_df)
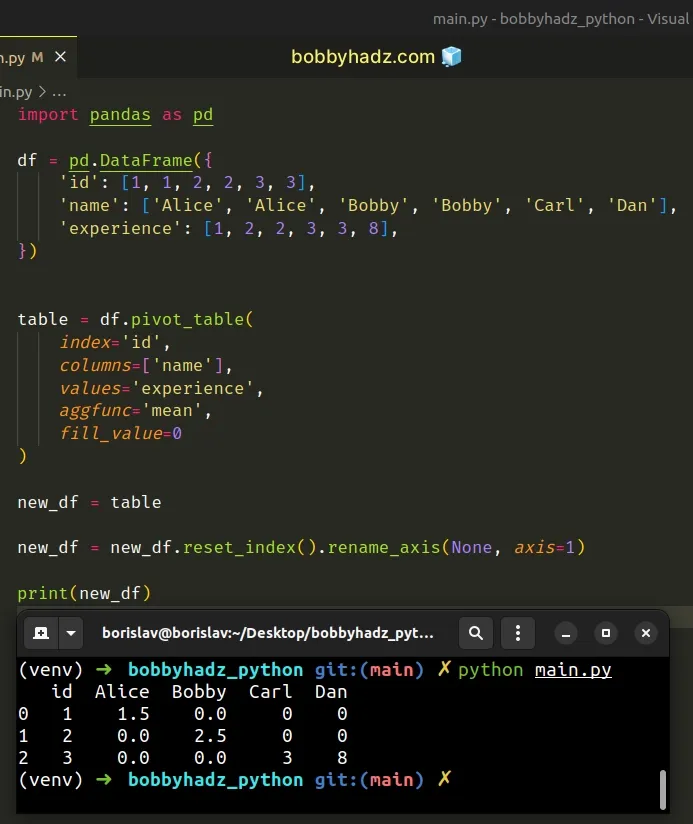
The DataFrame.rename_axis() method sets the name of the given axis for the
index of columns.
The first argument we passed to the method is a value to set the axis name attribute to.
The axis argument is the axis to rename.
By default, the axis defaults to 0 (the index).
We set the axis argument to 1 to rename the column axis.
If you need to rename the columns of the new DataFrame, use the columns
property.
new_df.columns = ['Alice1', 'Bobby2', 'Carl3', 'Dan4']
# Convert a Pivot Table to a DataFrame using to_records()
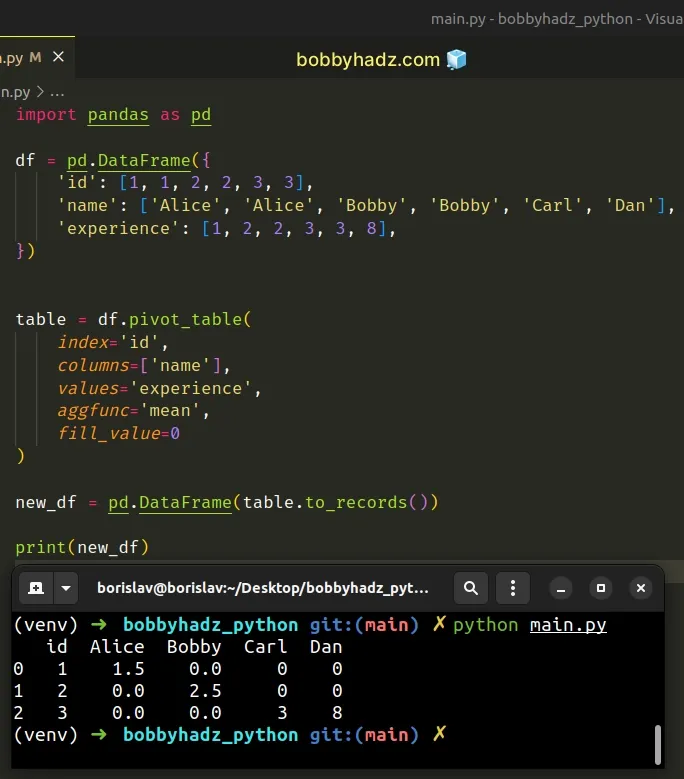
You can also use the
pandas.DataFrame
constructor and the
DataFrame.to_records()
method to convert a pivot table to a DataFrame.
import pandas as pd df = pd.DataFrame({ 'id': [1, 1, 2, 2, 3, 3], 'name': ['Alice', 'Alice', 'Bobby', 'Bobby', 'Carl', 'Dan'], 'experience': [1, 2, 2, 3, 3, 8], }) table = df.pivot_table( index='id', columns=['name'], values='experience', aggfunc='mean', fill_value=0 ) new_df = pd.DataFrame(table.to_records()) # id Alice Bobby Carl Dan # 0 1 1.5 0.0 0 0 # 1 2 0.0 2.5 0 0 # 2 3 0.0 0.0 3 8 print(new_df)
The DataFrame.to_records() method converts a DataFrame to a NumPy record
array.
import pandas as pd df = pd.DataFrame({ 'id': [1, 1, 2, 2, 3, 3], 'name': ['Alice', 'Alice', 'Bobby', 'Bobby', 'Carl', 'Dan'], 'experience': [1, 2, 2, 3, 3, 8], }) table = df.pivot_table( index='id', columns=['name'], values='experience', aggfunc='mean', fill_value=0 ) # [(1, 1.5, 0. , 0, 0) (2, 0. , 2.5, 0, 0) (3, 0. , 0. , 3, 8)] print(table.to_records())
The to_records() method returns a NumPy ndarray with the DataFrame labels
as fields and each row of the DataFrame as entries.
The last step is to pass the ndarray to the pandas.DataFrame() constructor.
# Additional Resources
You can learn more about the related topics by checking out the following tutorials:
- Pandas: Convert a DataFrame to a List of Dictionaries
- Pandas: GroupBy columns with NaN (missing) values
- Panda: Using fillna() with specific columns in a DataFrame
- Pandas: Split a Column of Lists into Multiple Columns
- How to Split a Pandas DataFrame into Chunks
- Pandas: Count the unique combinations of two Columns
- How to read a .mat (Matplotlib) file in Python
- Python: How to center the Title in Plotly
- Must have equal len keys and value when setting with iterable
- Cannot convert non-finite values (NA or inf) to integer
- Pandas: How to efficiently Read a Large CSV File