Pandas: Annotate data points while plotting from DataFrame
Last updated: Apr 12, 2024
Reading time·3 min

# Table of Contents
- Pandas: Annotate data points while plotting from DataFrame
- Prettifying the annotations by passing more arguments to Axes.annotate()
- Pandas: Annotate data points while plotting from DataFrame using apply()
# Pandas: Annotate data points while plotting from DataFrame
To annotate data points while plotting from a Pandas DataFrame:
- Use a
forloop to iterate over the DataFrame's rows. - On each iteration, call the
axes.annotate()method. - The method annotates the point with the specified text.
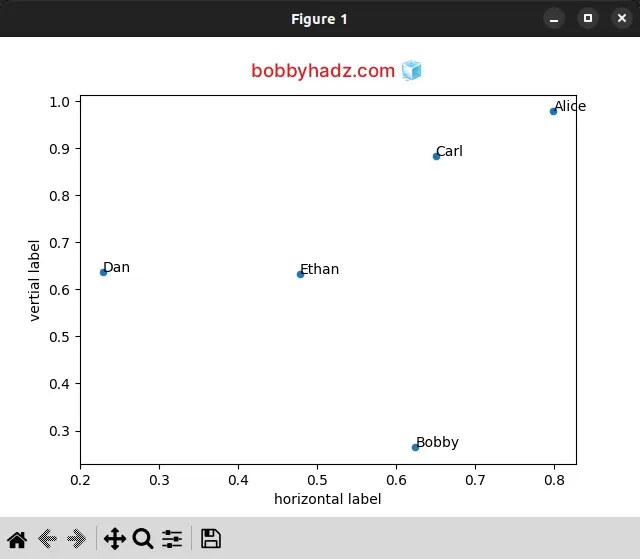
import pandas as pd import matplotlib.pyplot as plt df = pd.DataFrame({ 'x': [0.79974873, 0.62466539, 0.65046638, 0.22819233, 0.47786481], 'y': [0.97827185, 0.26413242, 0.88445034, 0.6379751, 0.63235667], 'name': ['Alice', 'Bobby', 'Carl', 'Dan', 'Ethan'] }) fig, ax = plt.subplots() df.plot('x', 'y', kind='scatter', ax=ax) for index, row in df.iterrows(): ax.annotate(row['name'], (row['x'], row['y'])) ax.set_xlabel('horizontal label') ax.set_ylabel('vertial label') plt.show()

We used the matplotlib.pyplot.subplots() method to create a figure and a set
of subplots.
fig, ax = plt.subplots()
The next step is to use the DataFrame.plot() method to plot a scatter plot.
df.plot('x', 'y', kind='scatter', ax=ax)
The DataFrame.iterrows() method enables us to iterate over the DataFrame's rows as (index, Series) pairs.
for index, row in df.iterrows(): ax.annotate(row['name'], (row['x'], row['y']))
On each iteration, we pass 2 arguments to the Axes.annotate() method:
- The text of the annotation.
- A tuple containing the
xandyvalues (point) to annotate.
However, by default, the annotated data points don't look very good.

# Prettifying the annotations by passing more arguments to Axes.annotate()
You can prettify the way annotations are displayed by passing additional
arguments to the Axes.annotate() method.
Here is an example.
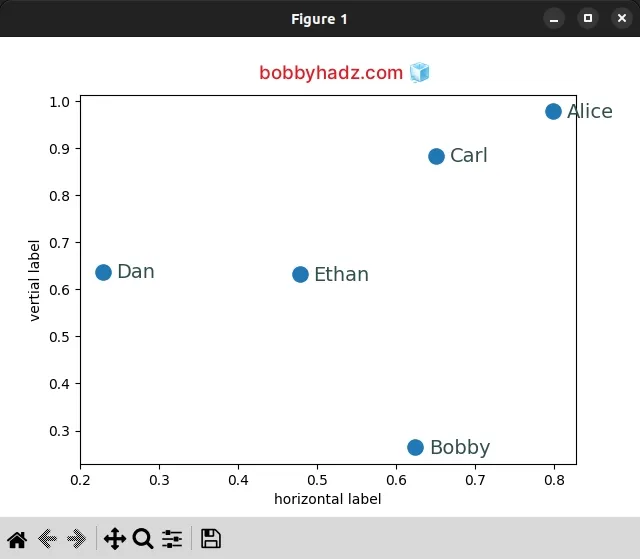
import pandas as pd import matplotlib.pyplot as plt df = pd.DataFrame({ 'x': [0.79974873, 0.62466539, 0.65046638, 0.22819233, 0.47786481], 'y': [0.97827185, 0.26413242, 0.88445034, 0.6379751, 0.63235667], 'name': ['Alice', 'Bobby', 'Carl', 'Dan', 'Ethan'] }) fig, ax = plt.subplots() df.plot('x', 'y', kind='scatter', ax=ax, s=120) print(df.iterrows()) for index, row in df.iterrows(): ax.annotate( row['name'], (row['x'], row['y']), xytext=(10, -5), textcoords='offset points', fontsize=14, color='darkslategrey', family='sans-serif' ) ax.set_xlabel('horizontal label') ax.set_ylabel('vertial label') plt.show()

The additional arguments we passed to Axes.annotate() are:
xytext- the position (x, y) to place the text at. The coordinate system is determined by thetextcoordsargument.textcoords- the coordinate system thatxytextis given in. Can be 1 of 2 values:"offset points"- offset (in points) from thexyvalue."offset pixels"- offset (in pixels) from thexyvalue.
fontsize- the font size of the annotated text.color- the color of the annotated text.family- the font family of the annotated text.
You can read more about the arguments the Axes.annotate() method takes in
this section
of the docs.
# Pandas: Annotate data points while plotting from DataFrame using apply()
You can also use the DataFrame.apply() method to annotate data points while
plotting from a Pandas DataFrame.
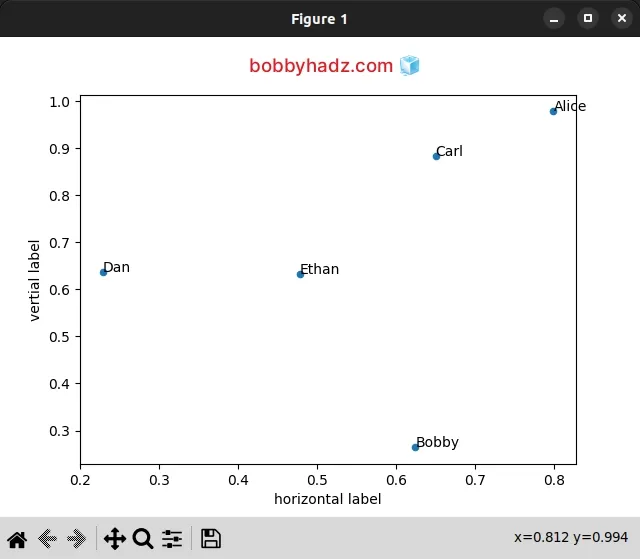
import pandas as pd import matplotlib.pyplot as plt df = pd.DataFrame({ 'x': [0.79974873, 0.62466539, 0.65046638, 0.22819233, 0.47786481], 'y': [0.97827185, 0.26413242, 0.88445034, 0.6379751, 0.63235667], 'name': ['Alice', 'Bobby', 'Carl', 'Dan', 'Ethan'] }) fig, ax = plt.subplots() df.plot('x', 'y', kind='scatter', ax=ax) df[['x', 'y', 'name']].apply(lambda row: ax.text(*row), axis=1) ax.set_xlabel('horizontal label') ax.set_ylabel('vertial label') plt.show()

The
DataFrame.apply()
method applies a function along an axis of the DataFrame.
We set the axis argument to 1 to apply the function to each row.
The
Axes.text()
method adds the specified text to the axes at location x, y.
# Additional Resources
You can learn more about the related topics by checking out the following tutorials:
- Pandas: GroupBy columns with NaN (missing) values
- Panda: Using fillna() with specific columns in a DataFrame
- Pandas: Remove non-numeric rows in a DataFrame column
- NumPy: Apply a Mask from one Array to another Array
- Pandas: Select rows based on a List of Indices
- Pandas: Find an element's Index in Series [7 Ways]
- Annotate Bars in Barplot with Pandas and Matplotlib
- Pandas: Create a Tuple from two DataFrame Columns
- Disable the TOKENIZERS_PARALLELISM=(true | false) warning
- RuntimeError: Expected scalar type Float but found Double
- Pandas: Convert timezone-aware DateTimeIndex to naive timestamp
- RuntimeError: Input type (torch.FloatTensor) and weight type (torch.cuda.FloatTensor) should be the same
- How to read a .mat (Matplotlib) file in Python
- Python: How to center the Title in Plotly
- ValueError: Expected object or value with
pd.read_json() - Mixing dicts with non-Series may lead to ambiguous ordering
- ValueError: NaTType does not support strftime [Solved]
- Must have equal len keys and value when setting with iterable
- PyTorch: Trying to backward through the graph a second time
- Pandas: Unalignable boolean Series provided as indexer

