Interpolating NaN values in a NumPy Array in Python
Last updated: Apr 12, 2024
Reading time·4 min

# Table of Contents
- Interpolating NaN values in a NumPy Array in Python
- Interpolating NaN values in a NumPy Array using pandas
# Interpolating NaN values in a NumPy Array in Python
You can use the numpy.interp() method to interpolate the NaN values in a
NumPy array.
The method performs one-dimensional linear interpolation for monotonically increasing sample points.
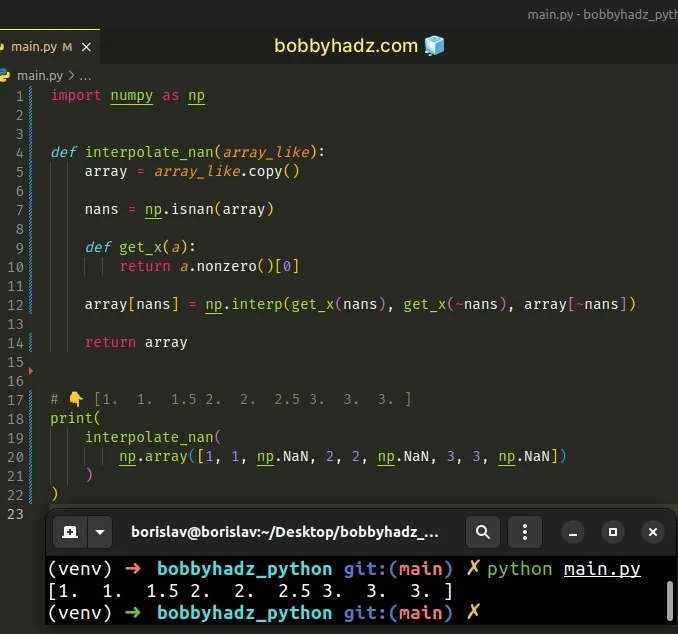
import numpy as np def interpolate_nan(array_like): array = array_like.copy() nans = np.isnan(array) def get_x(a): return a.nonzero()[0] array[nans] = np.interp(get_x(nans), get_x(~nans), array[~nans]) return array # 👇️ [1. 1. 1.5 2. 2. 2.5 3. 3. 3. ] print( interpolate_nan( np.array([1, 1, np.NaN, 2, 2, np.NaN, 3, 3, np.NaN]) ) )

The interpolate_nan() function takes a NumPy array as a parameter and replaces
the NaN values in the array with the linearly interpolated values.
You can also use a more manual and verbose approach to interpolate the NaN values in a NumPy array.
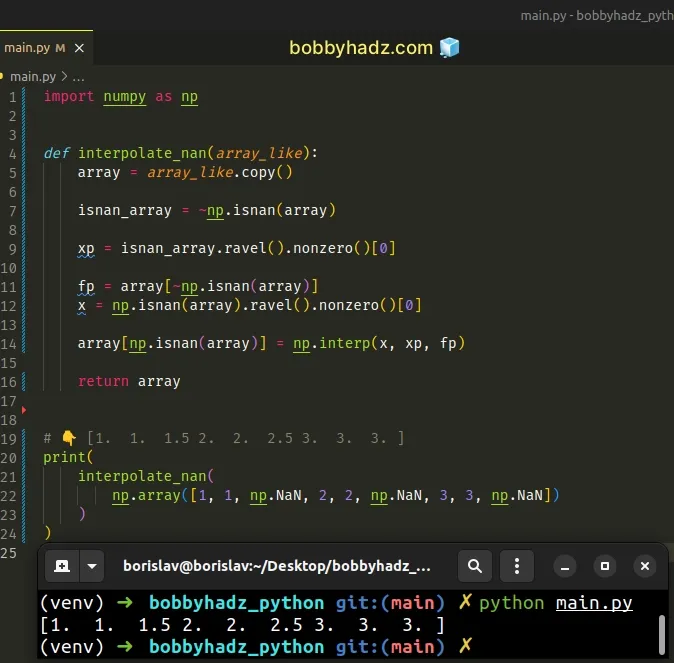
import numpy as np def interpolate_nan(array_like): array = array_like.copy() isnan_array = ~np.isnan(array) xp = isnan_array.ravel().nonzero()[0] fp = array[~np.isnan(array)] x = np.isnan(array).ravel().nonzero()[0] array[np.isnan(array)] = np.interp(x, xp, fp) return array # 👇️ [1. 1. 1.5 2. 2. 2.5 3. 3. 3. ] print( interpolate_nan( np.array([1, 1, np.NaN, 2, 2, np.NaN, 3, 3, np.NaN]) ) )

The function takes a NumPy array as a parameter and replaces the NaN values in the array with the linearly interpolated values.
The numpy.interp() method performs one-dimensional linear interpolation for monotonically increasing sample points.
The method returns the one-dimensional linear interpolant with the given
discrete data points (xp, fp), evaluated at x.
array[np.isnan(array)] = np.interp(x, xp, fp)
The x argument is an array-like object that contains the x-coordinates at
which to evaluate the interpolated values.
The x array contains the indices of the np.NaN values in the input array.
# 👇️ the input array # np.array([1, 1, np.NaN, 2, 2, np.NaN, 3, 3, np.NaN]) x = np.isnan(array).ravel().nonzero()[0] print(x) # [2 5 8]
The xp argument stores the indices of the non-NaN values in the array.
The argument represents the x-coordinates of the data points.
xp = isnan_array.ravel().nonzero()[0] print(xp) # 👉️ [0 1 3 4 6 7]
The fp argument represents the y-coordinates of the data points and is the
same length as xp.
fp = array[~np.isnan(array)] print(fp) # 👉️ [1. 1. 2. 2. 3. 3.]
# Interpolating NaN values in a NumPy Array using pandas
You can also use the
Series.interpolate
method from pandas to interpolate the NaN values in a NumPy array.
First, make sure that you have the pandas module installed.
pip install numpy pandas # or with pip3 pip3 install numpy pandas
Now import and use the module as follows.
import numpy as np import pandas as pd arr = np.array([1, 1, np.NaN, 2, 2, np.NaN, 3, 3, np.NaN]) # 👇️ [1.0, 1.0, 1.5, 2.0, 2.0, 2.5, 3.0, 3.0, 3.0] print(pd.Series(arr).interpolate().tolist())

We first used the
pandas.Series()
constructor to convert the NumPy array to a Series.
import numpy as np import pandas as pd arr = np.array([1, 1, np.NaN, 2, 2, np.NaN, 3, 3, np.NaN]) # 0 1.0 # 1 1.0 # 2 NaN # 3 2.0 # 4 2.0 # 5 NaN # 6 3.0 # 7 3.0 # 8 NaN # dtype: float64 print(pd.Series(arr))
Series objects have an interpolate() method that fills NaN values using an
interpolation method.
import numpy as np import pandas as pd arr = np.array([1, 1, np.NaN, 2, 2, np.NaN, 3, 3, np.NaN]) # 👇️ [1.0, 1.0, 1.5, 2.0, 2.0, 2.5, 3.0, 3.0, 3.0] print(pd.Series(arr).interpolate().tolist())
The method returns a Series, interpolated at some or all NaN values.
The last step is to use the
Series.tolist()
method to convert the Series to a list object.
You can access the values attribute on the result to get an array instead of a
list.
import numpy as np import pandas as pd arr = np.array([1, 1, np.NaN, 2, 2, np.NaN, 3, 3, np.NaN]) # 👇️ [1. 1. 1.5 2. 2. 2.5 3. 3. 3. ] print(pd.Series(arr).interpolate().values)
The
Series.values
attribute returns the Series as an ndarray or an ndarray-like object
(depending on the
dtype).
# Additional Resources
You can learn more about the related topics by checking out the following tutorials:
- ValueError: object too deep for desired array [Solved]
- Only one element tensors can be converted to Python scalars
- Replace negative Numbers in a Pandas DataFrame with Zero
- Pandas: Sum the values in a Column that match a Condition
- Pandas: Make new Column from string Slice of another Column
- Pandas: Calculate mean (average) across multiple DataFrames
- NumPy or Pandas: How to check a Value or an Array for NaT
- NumPy: Calculate the distance between a Point and a Line
- Pandas: Cannot setitem on a Categorical with a new category
- Only valid with DatetimeIndex, TimedeltaIndex or PeriodIndex, but got an instance of X
- numpy.linalg.LinAlgError: Singular matrix [Solved]
- All the input arrays must have same number of dimensions
- ValueError: Index contains duplicate entries, cannot reshape

