Pycharm does not show a Matplotlib Plot issue [Solved]
Last updated: Apr 10, 2024
Reading time·3 min

# Pycharm does not show a Matplotlib Plot issue [Solved]
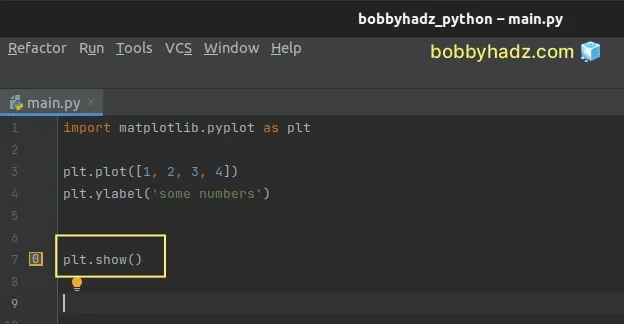
To resolve the issue where Pycharm doesn't show a Matplotlib plot, make sure
to call the plt.show() method at the end of your code.
The method displays all open figures.
import matplotlib.pyplot as plt plt.plot([1, 2, 3, 4]) plt.ylabel('some numbers') # 👇️ Call plt.show() plt.show()
You can run your code in Pycharm by clicking on the green triangle button at the
top right corner or by pressing Shift + F10.
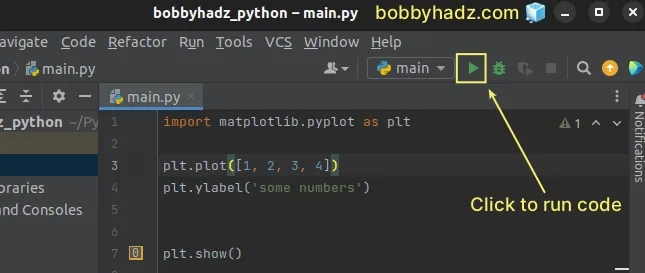
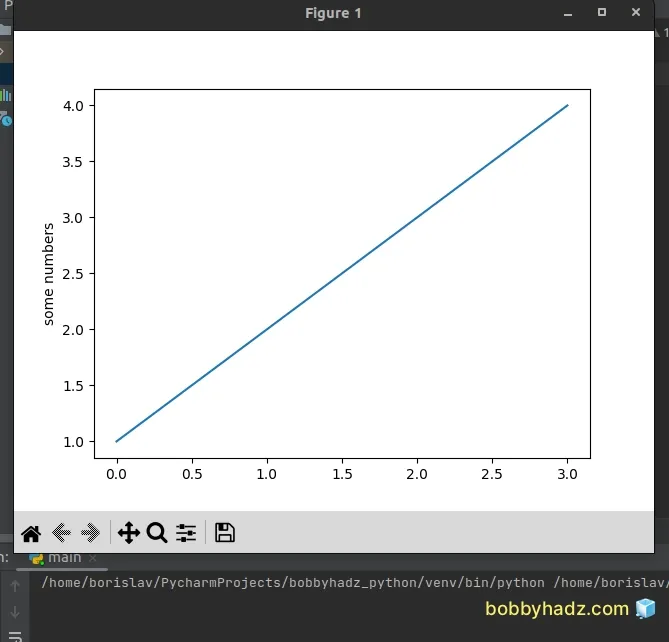
Once you click on the button, the plot is shown.
Make sure you have installed the matplotlib module by running the following command.
pip install matplotlib # or with pip3 pip3 install matplotlib
Another thing you should check is that your import statement is correct.
# Make sure your import statement is correct
Make sure your import statement is import matplotlib.pyplot as plt to be able
to call the plt.show() method as shown below.
import matplotlib.pyplot as plt plt.plot([1, 2, 3, 4]) plt.ylabel('some numbers') # 👇️ call plt.show() plt.show()
If the issue persists, try to set the block keyword argument to True when
calling plt.show().
import matplotlib.pyplot as plt plt.plot([1, 2, 3, 4]) plt.ylabel('some numbers') # 👇️ set block to True plt.show(block=True)
Make sure to add the plt.show() call at the end of your code, after the
plt.plot() method call.
The block keyword argument determines whether to wait for all figures to be
closed before returning.
If set to True, then the blocking behavior runs the GUI main loop until all
figure windows are closed.
The value of the block argument defaults to True in non-interactive mode and
False in interactive mode.
In other words, if you've set plt.interactive(True), you might run into issues
where the plot is not shown.
However, if you set block=True when calling plt.show(), the plot should be
shown even in interactive mode.
If the issue persists, try to set the mode to non-interactive explicitly.
import matplotlib.pyplot as plt plt.plot([1, 2, 3, 4]) plt.ylabel('some numbers') # 👇️ set block to True plt.show(block=True) # 👇️ set to non-interactive mode plt.interactive(False)
The last line sets the mode to non-interactive.
In non-interactive mode:
pyplot.show()will block by default.- newly crated figures and changes to figures are not reflected until explicitly asked to be.
# Try setting a matplotlib backend
If the issue persists, try to set a matplotlib backend with the
matplotlib.use() command.
import matplotlib import matplotlib.pyplot as plt plt.plot([1, 2, 3, 4]) plt.ylabel('some numbers') # 👇️ set tkinter backend matplotlib.use('TkAgg') # 👇️ call plt.show() plt.show(block=True)
The matplotlib.use() method is used to select the backend that is used for
rendering and GUI integration.
We used TkAgg for the backend - Agg rendering to a Tk canvas (requires
Tkinter).
If you don't have Tkinter installed, follow the installation instructions in this article.
Alternatively, you can set the backend to QtAgg.
matplotlib.use('QtAgg')
It enables Agg rendering in a Qt canvas and requires PyQT.
# Additional Resources
You can learn more about the related topics by checking out the following tutorials:
- How to check your Python version in Jupyter Notebook
- Note: you may need to restart the kernel to use updated packages
- How to add a new line in a Jupyter Notebook markdown cell
- Error executing Jupyter command 'notebook': [Errno 2] No such file or directory
- The purpose of the exclamation mark (!) in Jupyter Notebook
- How to show (or hide) the Line Numbers in Jupyter Notebook
- How to display Lists as a Table in Jupyter Notebook
- How to show a PIL Image in Jupyter Notebook
- How to measure Cell execution Time in Jupyter Notebook
- [Solved] Jupyter Notebook not running code Stuck on In [*]
- TypeError: Image data cannot be converted to float [Solved]
- Python: Process finished with exit code 137 in PyCharm
- Matplotlib: No artists with labels found to put in legend
- Matplotlib: How to add an Average Line to a Plot