Matplotlib: No artists with labels found to put in legend
Last updated: Apr 12, 2024
Reading time·5 min

# Table of Contents
- Matplotlib: No artists with labels found to put in legend
- Calling the plt.legend() or ax.legend() methods multiple times
- Try using ax.legend() instead of plt.legend()
- Trying to place a legend on the axes before creating a plot
# Matplotlib: No artists with labels found to put in legend
The Matplotlib warning "No artists with labels found to put in legend" is shown for multiple reasons:
- Not specifying labels at artist creation time or by calling
set_label(). - Trying to place a legend on the axes before creating a plot.
- Calling the
plt.legend()orax.legend()methods multiple times. For example, trying to set the font size before having created the legend.
Here is an example of when the warning is shown.
import pandas as pd import matplotlib.pyplot as plt test_data = pd.DataFrame.from_dict({ 'x': {0: 9.49084, 1: 14.47866, 2: 5.06412, 3: 11.27358, 4: 5.33439}, 'y': {0: 1.35503, 1: 9.01758, 2: 7.36345, 3: 7.36519, 4: 6.73471} }) fig = plt.figure() ax = fig.add_subplot(221) data = plt.scatter(test_data.x, test_data.y) # ⛔️ No artists with labels found to put in legend. Note that artists whose label start with an underscore are ignored when legend() is called with no argument. ax.legend() plt.show()
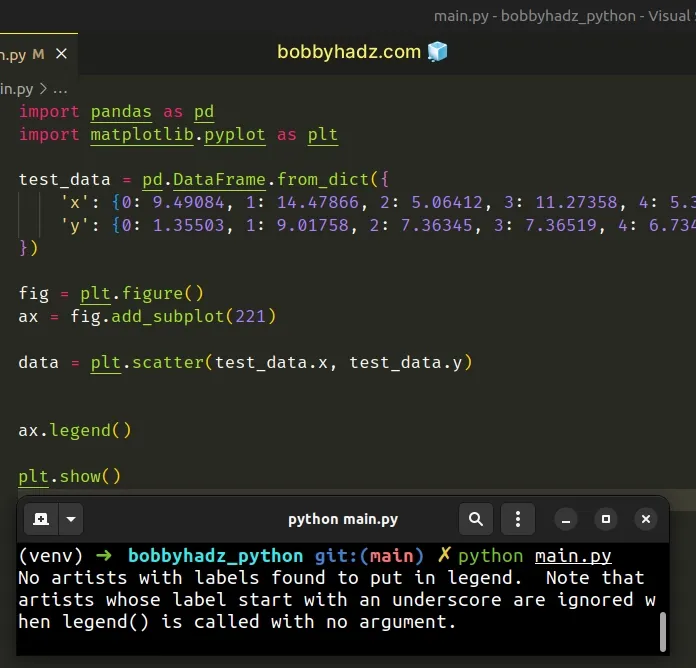
The Matplotlib Artist is the object that knows how to use a renderer to paint onto the canvas.
The warning is shown because we didn't specify the handles and labels.
One way to resolve the issue is to pass the handles and labels as arguments to the axes.legend() method.
import pandas as pd import matplotlib.pyplot as plt test_data = pd.DataFrame.from_dict({ 'x': {0: 9.49084, 1: 14.47866, 2: 5.06412, 3: 11.27358, 4: 5.33439}, 'y': {0: 1.35503, 1: 9.01758, 2: 7.36345, 3: 7.36519, 4: 6.73471} }) fig = plt.figure() ax = fig.add_subplot(221) data = plt.scatter(test_data.x, test_data.y) ax.legend([data], ['dots']) plt.show()
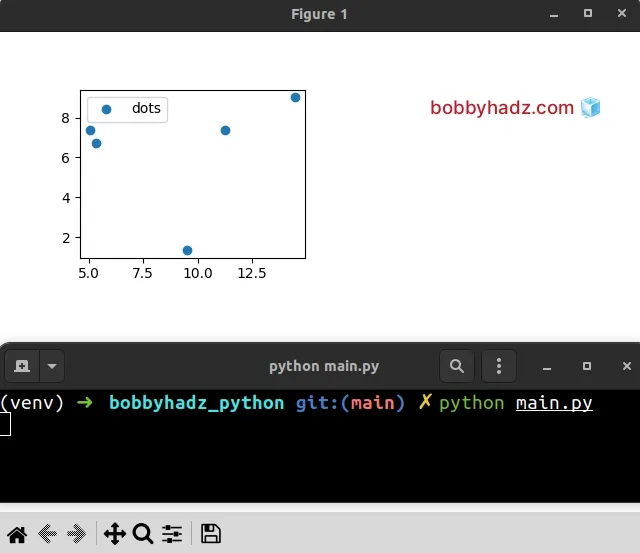
The first argument we passed to the axes.legend() method is a list containing
the handles and the second is a list containing the labels.
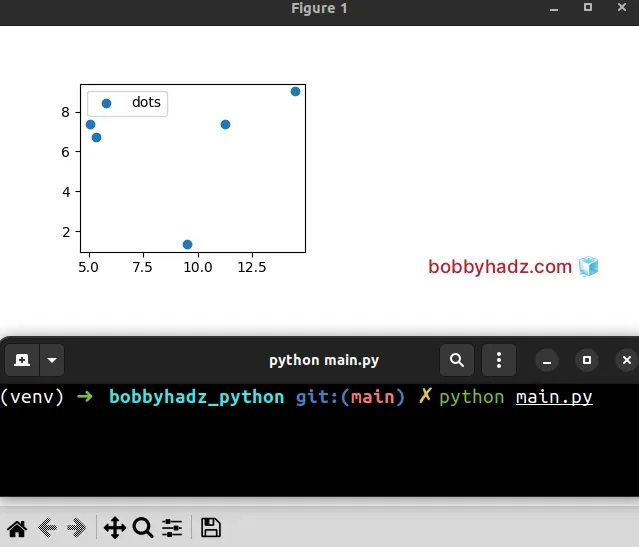
You can also pass a list containing the labels as an argument to
axes.legend().
import pandas as pd import matplotlib.pyplot as plt test_data = pd.DataFrame.from_dict({ 'x': {0: 9.49084, 1: 14.47866, 2: 5.06412, 3: 11.27358, 4: 5.33439}, 'y': {0: 1.35503, 1: 9.01758, 2: 7.36345, 3: 7.36519, 4: 6.73471} }) fig = plt.figure() ax = fig.add_subplot(221) data = plt.scatter(test_data.x, test_data.y) ax.legend(['dots']) plt.show()
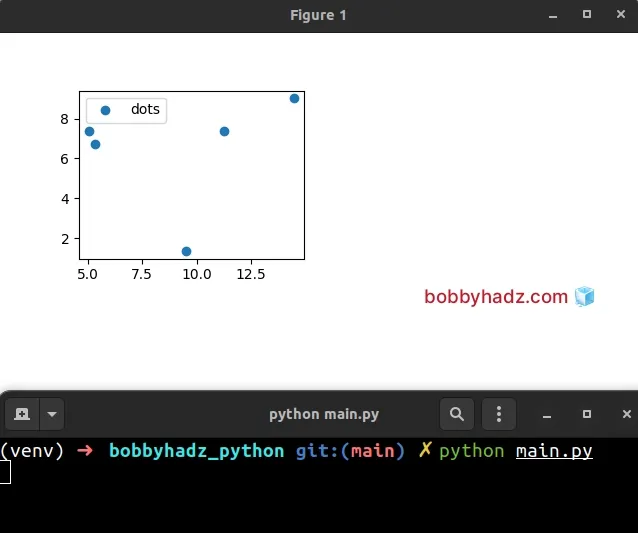
You can also use the Artist.set_label() method to set a label that will be displayed in the legend.
import pandas as pd import matplotlib.pyplot as plt test_data = pd.DataFrame.from_dict({ 'x': {0: 9.49084, 1: 14.47866, 2: 5.06412, 3: 11.27358, 4: 5.33439}, 'y': {0: 1.35503, 1: 9.01758, 2: 7.36345, 3: 7.36519, 4: 6.73471} }) fig = plt.figure() ax = fig.add_subplot(221) data = plt.scatter(test_data.x, test_data.y) data.set_label('dots') ax.legend() plt.show()
You can also specify the labels at artist creation time, e.g. when calling
ax.plot() (or plt.scatter() in the example).
import pandas as pd import matplotlib.pyplot as plt test_data = pd.DataFrame.from_dict({ 'x': {0: 9.49084, 1: 14.47866, 2: 5.06412, 3: 11.27358, 4: 5.33439}, 'y': {0: 1.35503, 1: 9.01758, 2: 7.36345, 3: 7.36519, 4: 6.73471} }) fig = plt.figure() ax = fig.add_subplot(221) data = plt.scatter(test_data.x, test_data.y, label='dots') ax.legend() plt.show()
Notice that we passed the label keyword argument when calling plt.scatter().
Matplotlib tries to determine the elements that are to be added to the legend automatically when you don't explicitly pass extra arguments.
However, in some cases, you have to explicitly set the labels.
You can either do this by setting the label keyword argument.
ax.plot([1, 2, 3], label='Inline label') ax.legend()
Or by using the set_label method.
line, = ax.plot([1, 2, 3]) line.set_label('Label via method') ax.legend()
Make sure to set the label before calling ax.legend(), otherwise, the warning
is shown.
# Calling the plt.legend() or ax.legend() methods multiple times
You will also get the warning if you call the plt.legend() or ax.legend()
methods multiple times.
import pandas as pd import matplotlib.pyplot as plt test_data = pd.DataFrame.from_dict({ 'x': {0: 9.49084, 1: 14.47866, 2: 5.06412, 3: 11.27358, 4: 5.33439}, 'y': {0: 1.35503, 1: 9.01758, 2: 7.36345, 3: 7.36519, 4: 6.73471} }) fig = plt.figure() ax = fig.add_subplot(221) data = plt.scatter(test_data.x, test_data.y) ax.legend(fontsize='x-large') # ⛔️ No artists with labels found to put in legend. Note that artists whose label start with an underscore are ignored when legend() is called with no argument. ax.legend(['dots']) plt.show()
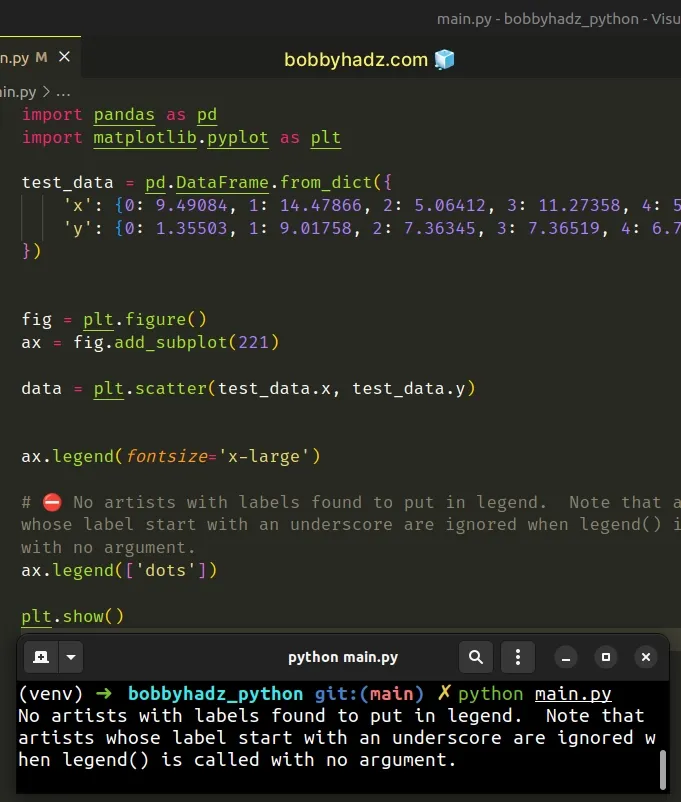
Notice that we called the ax.legend() method multiple times.
To resolve the issue in this case, pass the fontsize keyword argument when
placing the legend on the axes, in a single call.
import pandas as pd import matplotlib.pyplot as plt test_data = pd.DataFrame.from_dict({ 'x': {0: 9.49084, 1: 14.47866, 2: 5.06412, 3: 11.27358, 4: 5.33439}, 'y': {0: 1.35503, 1: 9.01758, 2: 7.36345, 3: 7.36519, 4: 6.73471} }) fig = plt.figure() ax = fig.add_subplot(221) data = plt.scatter(test_data.x, test_data.y) ax.legend(['dots'], fontsize='x-large') plt.show()
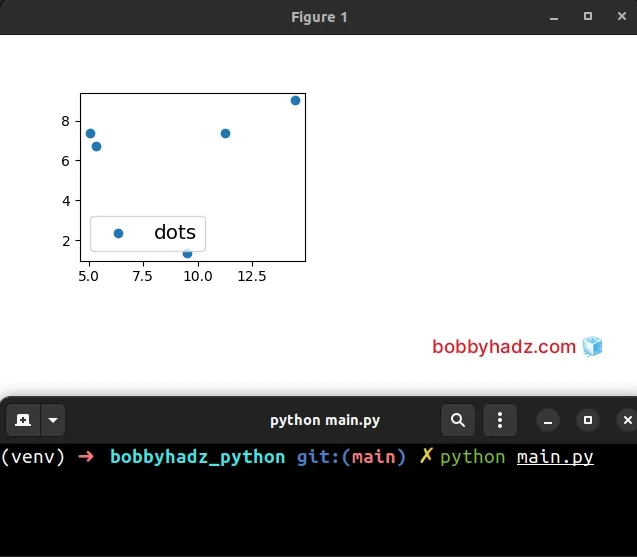
Now we only call the ax.legend() method once, after creating the plot and the
warning is no longer shown.
# Try using ax.legend() instead of plt.legend()
If the issue persists and you use plt.legend(), try to use ax.legend()
instead.
In other words, replace this:
plt.legend()
With this:
ax.legend()
Using the legend() method on the ax object often resolves the issue.
# Trying to place a legend on the axes before creating a plot
You will also get the warning if you try to place a legend on the axes before creating a plot.
Here is an example.
import pandas as pd import matplotlib.pyplot as plt test_data = pd.DataFrame.from_dict({ 'x': {0: 9.49084, 1: 14.47866, 2: 5.06412, 3: 11.27358, 4: 5.33439}, 'y': {0: 1.35503, 1: 9.01758, 2: 7.36345, 3: 7.36519, 4: 6.73471} }) # ⛔️ No artists with labels found to put in legend. Note that artists whose label start with an underscore are ignored when legend() is called with no argument. plt.legend() fig = plt.figure() ax = fig.add_subplot(221) data = plt.scatter(test_data.x, test_data.y, label='dots') plt.show()
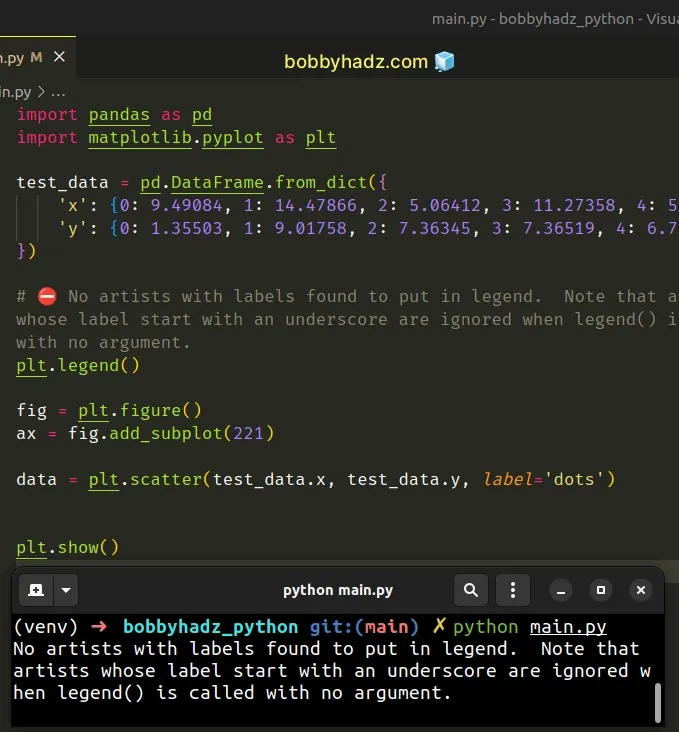
Notice that we called the plt.legend() method too early.
Make sure to call the method after you create a plot to resolve the issue.
import pandas as pd import matplotlib.pyplot as plt test_data = pd.DataFrame.from_dict({ 'x': {0: 9.49084, 1: 14.47866, 2: 5.06412, 3: 11.27358, 4: 5.33439}, 'y': {0: 1.35503, 1: 9.01758, 2: 7.36345, 3: 7.36519, 4: 6.73471} }) fig = plt.figure() ax = fig.add_subplot(221) data = plt.scatter(test_data.x, test_data.y, label='dots') # ✅ Move method call here plt.legend() plt.show()
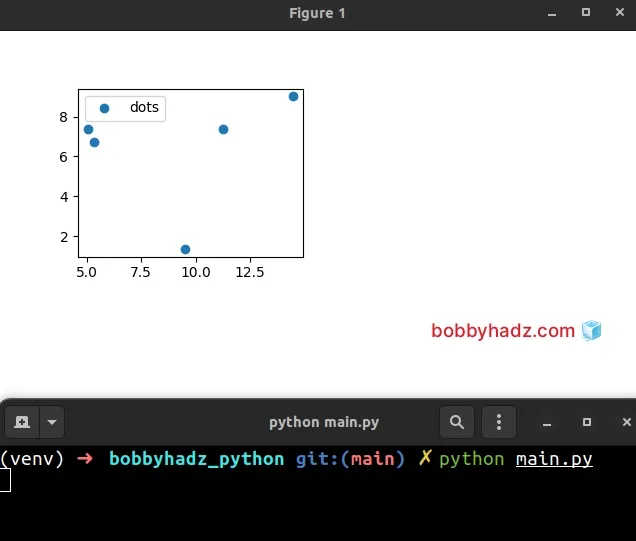
After moving the plt.legend() method call to the bottom, the issue is
resolved.
# Additional Resources
You can learn more about the related topics by checking out the following tutorials:
- ValueError: zero-dimensional arrays cannot be concatenated
- ValueError: all the input array dimensions for the concatenation axis must match exactly
- ValueError: cannot reshape array of size X into shape Y
- lbfgs failed to converge (status=1): STOP: TOTAL NO. of ITERATIONS REACHED LIMIT
- TypeError: Image data cannot be converted to float [Solved]
- How to clear the Terminal and Console in PyCharm
- Removing the Top and Right axis (spines) in Matplotlib
- Matplotlib: How to add an Average Line to a Plot