How to draw empty circles on a Scatter Plot in Matplotlib
Last updated: Apr 11, 2024
Reading time·3 min
# How to draw empty circles on a Scatter Plot in Matplotlib
To draw empty circles on a scatter plot in matplotlib:
- Use the
numpy.random.randn()method to get samples from the standard normal distribution for the values ofxandy - Pass
xandyto thepyplot.scatter()method.
import matplotlib.pyplot as plt import numpy as np x = np.random.randn(90) y = np.random.randn(90) print(x) plt.scatter(x, y, s=80, edgecolors='r', facecolors='none') plt.show()
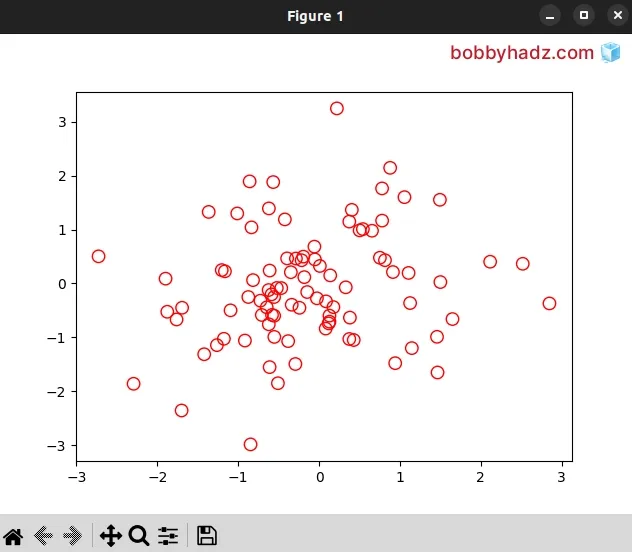
We used the numpy.random.randn() method to get samples from the standard normal distribution.
import matplotlib.pyplot as plt import numpy as np x = np.random.randn(90) y = np.random.randn(90)
The only argument we passed to the method is how many elements should be contained in the array.
The
matplotlib.pyplot.scatter()
method creates a scatter plot of y vs x with varying marker size and/or
color.
The x and y arguments are the data positions.
The s argument is the marker size in points**2. The default is
rcParams['lines.markersize'] ** 2.
import matplotlib.pyplot as plt import numpy as np x = np.random.randn(90) y = np.random.randn(90) print(x) plt.scatter(x, y, s=80, edgecolors='r', facecolors='none') plt.show()
The edgecolors parameter determines the edge color of the marker.
The parameter has the following possible values:
face- the edge color will always be the same as the face color.none- no patch boundary will be drawn.- A color or sequence of colors.
You can set the facecolors argument to the string "none" to plot unfilled
outlines.
The last step is to call the matplotlib.pyplot.show method to display all open figures.
Make sure to set the facecolors argument to the string "none" and not the
value None.
Here is an example of using a different color for the edges.
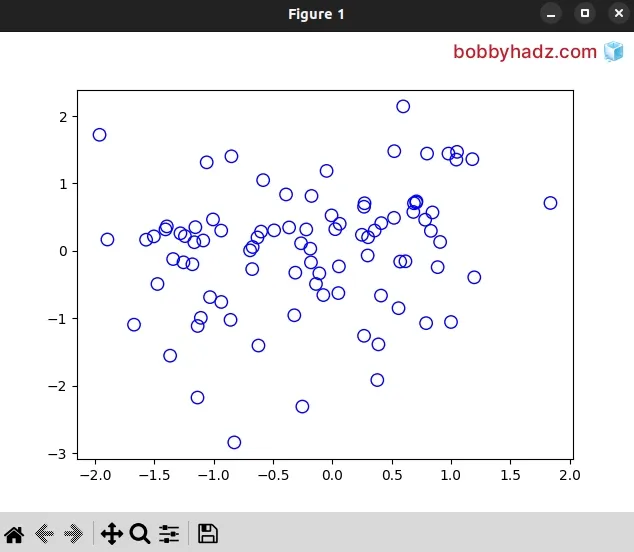
import matplotlib.pyplot as plt import numpy as np x = np.random.randn(90) y = np.random.randn(90) print(x) plt.scatter(x, y, s=80, edgecolors='blue', facecolors='none') plt.show()
Here is a more verbose example.
import matplotlib.pyplot as plt import numpy as np x = np.random.randn(60) y = np.random.randn(60) z = np.random.randn(60) path_collection = plt.scatter(x, y, s=80, c=z, cmap='viridis', edgecolors='b') path_collection.set_facecolor('none') plt.colorbar() plt.show()
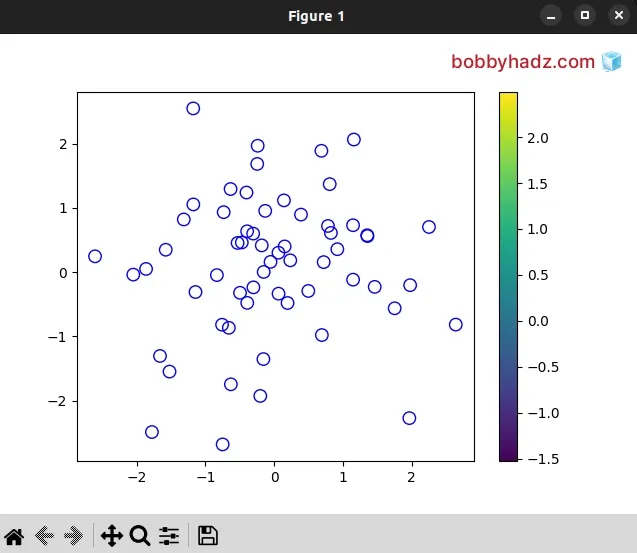
The c argument is an array-like list of marker colors.
The cmap argument is the colormap instance or registered colormap name that is
used to map scalar data to colors.
The set_facecolor() method sets the face color of the axes.
# Draw empty circles on a Scatter Plot in Matplotlib using plot()
You can also use the
pyplot.plot
method to draw empty circles on a scatter plot in matplotlib.
import matplotlib.pyplot as plt import numpy as np x = np.random.randn(90) y = np.random.randn(90) print(x) plt.plot(x, y, 'o', markerfacecolor='none') plt.show()
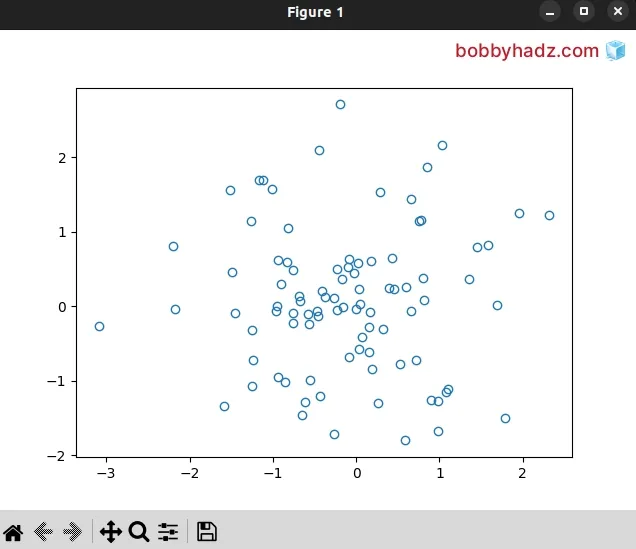
The x and y parameters are the coordinates of the points.
The third parameter enables us to specify basic formatting settings like color, marker and line style.
The string o is used for a circle marker.
The argument consists of a part for color, marker and line:
fmt = '[marker][line][color]'
Each of the values is optional.
If not provided, the value from the style cycle is used.
Here are some examples:
'b' # blue markers with default shape 'or' # red circles '-g' # green solid line '--' # dashed line with default color '^k:' # black triangle_up markers connected by a dotted line
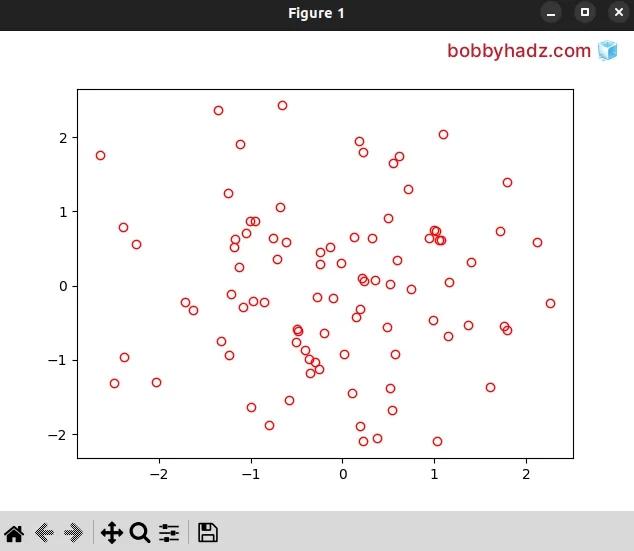
The following example sets the edge color of the marker to red.
import matplotlib.pyplot as plt import numpy as np x = np.random.randn(90) y = np.random.randn(90) print(x) plt.plot(x, y, 'or', markerfacecolor='none') plt.show()
# Additional Resources
You can learn more about the related topics by checking out the following tutorials:
- Copy a column from one DataFrame to another in Pandas
- AttributeError: Can only use .str accessor with string values
- ValueError: zero-dimensional arrays cannot be concatenated
- ValueError: zero-dimensional arrays cannot be concatenated
- ValueError: all the input array dimensions for the concatenation axis must match exactly
- ValueError: cannot reshape array of size X into shape Y
- lbfgs failed to converge (status=1): STOP: TOTAL NO. of ITERATIONS REACHED LIMIT
- TypeError: Image data cannot be converted to float [Solved]
- How to clear the Terminal and Console in PyCharm
- Matplotlib: No artists with labels found to put in legend
- Pandas: Create Scatter plot from multiple DataFrame columns
- How to read a .mat (Matplotlib) file in Python
- Matplotlib: How to add an Average Line to a Plot