VS Code taking too much Memory or CPU issue [Solutions]
Last updated: Apr 6, 2024
Reading time·7 min

# VS Code taking too much Memory or CPU issue [Solutions]
VS Code often takes too much memory and sometimes even causes an error when it runs out of memory.
Visual Studio Code Error: The window has crashed (reason: 'oom', code: '-536870904') We are sorry for the inconvenience. You can reopen the window to continue where you left off.
The most common causes of the issue are:
- not optimized extensions taking up too much memory or CPU.
- opening files that are too large.
- opening too many files at the same time.
- opening projects that are too large.
- having VS Code instances that run in the background.
The first thing you should try when VS Code takes too much memory is to open the Process Explorer.
- Press:
Ctrl+Shift+Pon Windows and Linux.Command+Shift+Pon macOS.
F1 to open the Command Palette.- Type process explorer and select Developer: Open Process Explorer.

You can view the running processes and track down which process takes the most memory.
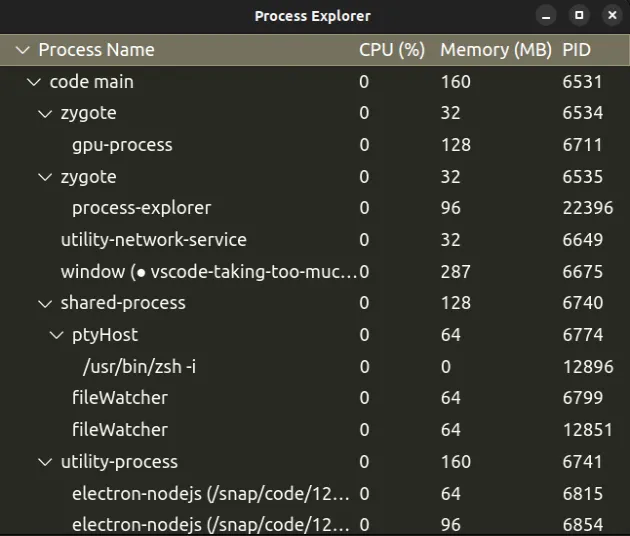
If you see an Extension Host entry that consumes a lot of memory or CPU, then the issue is likely caused by an extension.
For example, the Intellisense extension often causes a slowdown because it loads data on every keystroke.
Try to reproduce the issue with the Process Explorer window open and look at the CPU and memory consumption.
You can also take a snapshot of the running processes with the following command.
code --status
Most of the time, extensions that you install from the marketplace that aren't optimized cause the issue.
You might also run into issues if you install too many extensions that have to run every time you type a character to rerender the view.
# Configure paths to exclude from file watching
Make sure that all files you need to exclude from file watching have been excluded.
- Press
Ctrl+Shift+P(orCommand+Shift+Pon macOS).
F1 to open the Command Palette.- Type user settings and select Preferences: Open User Settings.
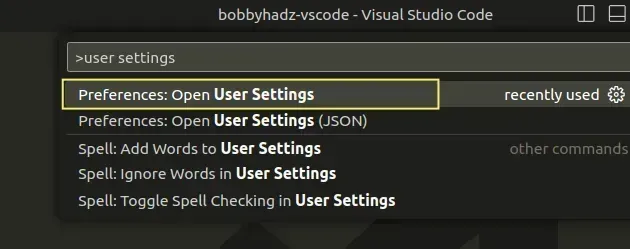
You can also open the settings screen by pressing Ctrl + , on Windows and
Linux or Cmd + , on macOS.
- Type watcher exclude and check the excluded files under Files: Watcher Exclude.
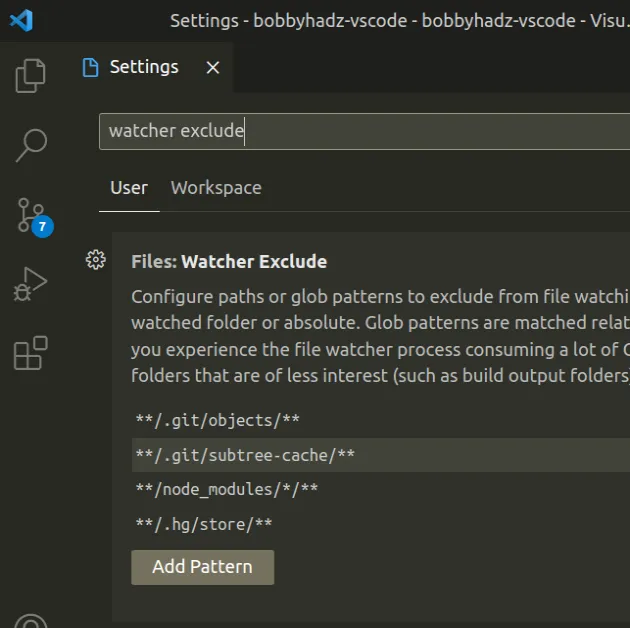
You can click on the Add Pattern button to add another pattern.
You should have at least the following patterns excluded:
**/.git/objects/****/.git/subtree-cache/****/node_modules/*/****/.hg/store/**
Make sure to exclude large folders that you don't want to watch, e.g. build output folders.
These extensions often cause VS Code to consume too much memory and CPU.
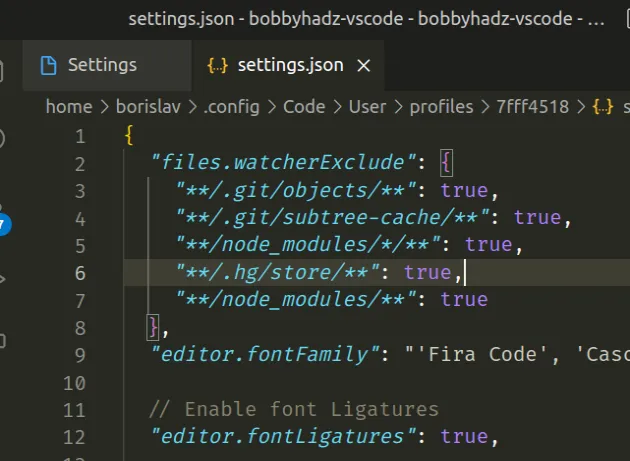
You can also set the files.WatcherExclude property directly in your
settings.json.
- Press
Ctrl+Shift+P(orCommand+Shift+Pon macOS).
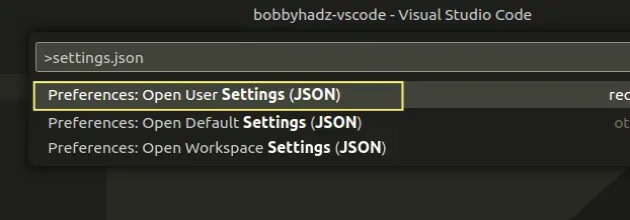
F1 to open the Command Palette.Type user settings json.
Click on Preferences: Open User Settings (JSON)
- Set the
files.watcherExcludeproperty, adding the patterns you want to exclude.
"files.watcherExclude": { "**/.git/objects/**": true, "**/.git/subtree-cache/**": true, "**/node_modules/*/**": true, "**/.hg/store/**": true, "**/node_modules/**": true },
# Try to close all running VS Code instances
You might have multiple VS Code processes that haven't closed properly running in the background.
Save your files and use a command to stop all VS Code instances.
The following command gets the job done on Windows.
# Windows taskkill /F /IM code.exe
Use the following command on macOS and Linux.
# macOS and Linux killall code
If you get an error, on macOS or Linux, issue the following command instead.
ps -ef | grep code | awk {'print $2'} | xargs kill -9
Try to restart VS Code after running the command and see if the issue persists.
# Starting VS Code with the extensions disabled
Something you can try to debug is to start VS Code with the extensions disabled.
If the issue resolves, you'll know that it is caused by an extension.
Open your terminal and run the following command.
code --disable-extensions
If you want to open the current folder with the extensions disabled, use the following command instead.
code . --disable-extensions
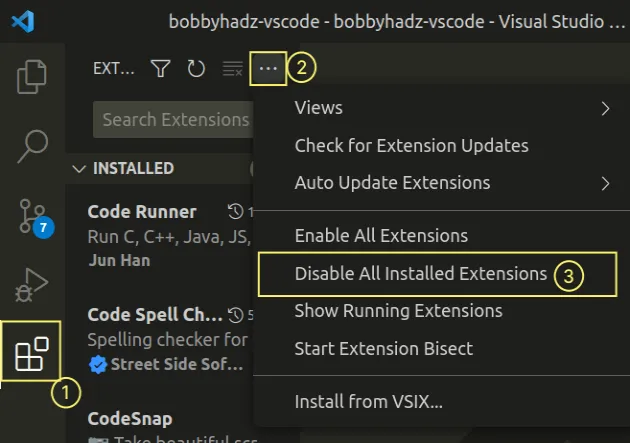
You can also disable all extensions directly in VS Code:
- Click on Extensions in the left sidebar.
- You can also open the Extensions menu by pressing:
Ctrl+Shift+Xon Windows or LinuxCommand+Shift+Xon macOS
- Click on the three dots
...icon at the top right corner. - Select Disable all Installed Extensions.
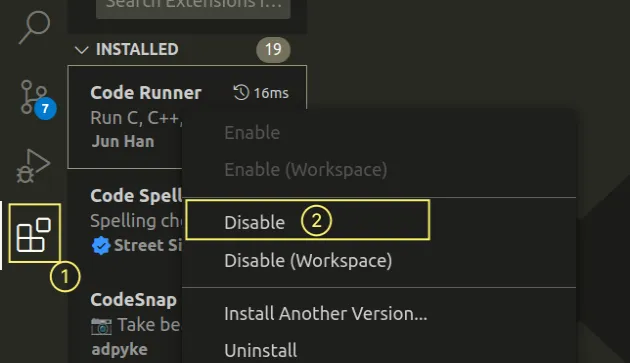
If the issue is resolved when the extensions are disabled, you can try to disable specific extensions to see which extension causes it.
You can right-click on an extension and then select Disable to disable it.
Then restart VS Code and check if memory and CPU consumption have dropped.
# Try to delete your backups directory
The Backups directory often causes issues when you open a file that is too
large by mistake.
This might cause VS Code to crash and try to reopen the file every time you relaunch the application.
You can use the following command to delete the backups directory on Windows.
# Windows del /F /Q /S "%APPDATA%\Code\Backups\*"
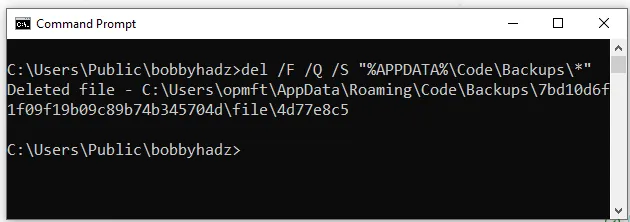
If you get prompted for confirmation, type Y and press Enter.
On macOS, open bash and run the following command.
# macOS rm -rf "~/Library/Application\ Support/Code/Backups/*"
If you get prompted, type y and press Enter.
On Linux, issue the following command in bash.
# Linux rm -rf "$HOME/.config/Code/Backups/*"
If you get prompted, type y and press Enter.
If VS Code crashes because it tries to open a file that's too large, try to open
it with the extensions disabled and the --max-memory flag set.
code --disable-extensions --max-memory=12288mb
If you want to open it in the current directly, use the following command instead.
code . --disable-extensions --max-memory=12288mb
Once you open VS Code, close the large file and the issue should be resolved.
# Using the Start Extension Bisect command
You can also use the start extension bisect command to try to identify if a certain extension is causing the issue.
- Press:
Ctrl+Shift+Pon Windows and LinuxCommand+Shift+Pon macOS
F1 to open the Command Palette.- Type start extension bisect and select Help: Start Extension Bisect.

Extension Bisect uses binary search to find the extension that causes memory and CPU issues.
During the process, the window reloads repeatedly and prompts you to confirm if you still encounter the issue.
Extension Bisect will disable your extensions and prompt you if you can still reproduce the issue.
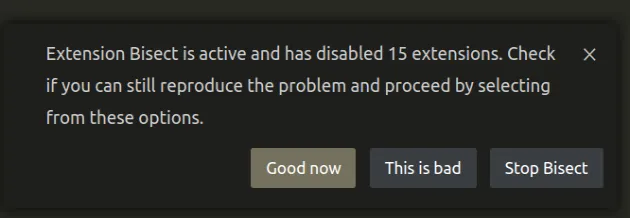
If you aren't able to reproduce the issue, click on Good now.
The command will then disable fewer extensions and prompt you if you can reproduce the issue.
The goal is to identify the offending extensions.
# Create a CPU profile of the running extensions
Another thing you can try is to create a CPU profile of the running extensions.
- Press:
Ctrl+Shift+Pon Windows and Linux.Command+Shift+Pon macOS.
F1 to open the Command Palette.- Type developer show extensions and select Developer: Show Running Extensions.

- Check the activation time of each extension and make sure there aren't any extensions that take too long to boot.
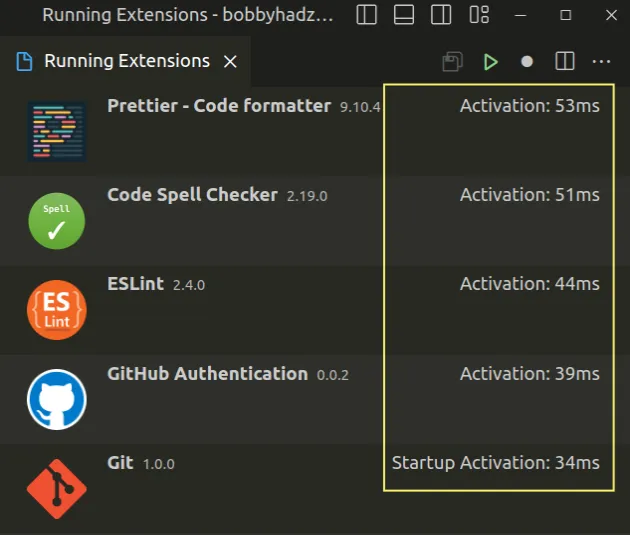
- Click on the start extension host profile button at the top right corner.
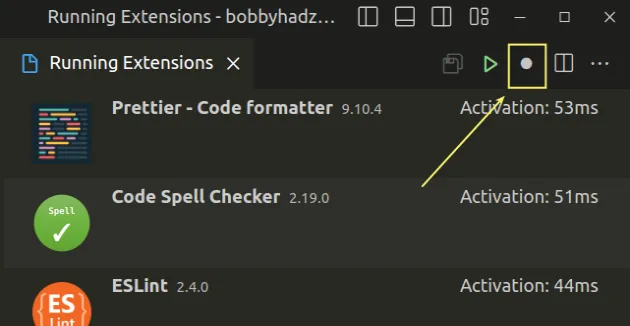
- Perform some steps to reproduce the slowdown.
- Stop the recording by clicking on the same button.
- Save the extension host profile by clicking on the floppy disk icon.
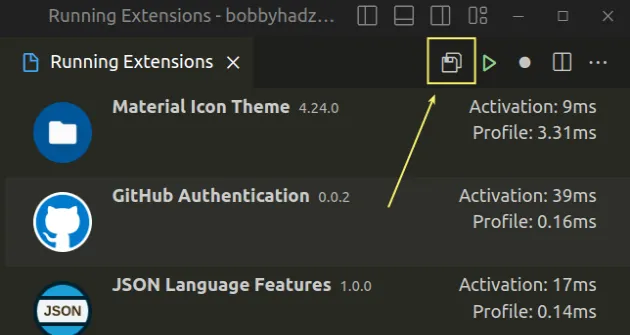
You can either attach the profile when opening a VS Code Github issue (or an extension-specific issue) or read the output yourself.
To read the output yourself:
- remove the trailing
.txtextension from the filename. - open a Google Chrome window.
- open the developer tools in your browser by pressing
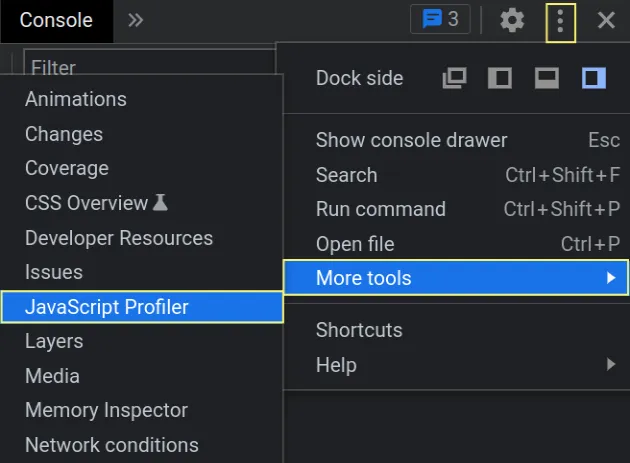
F12. - Click on the three dots icon, then select More Tools and then click on JavaScript Profiler as shown in the screenshot.
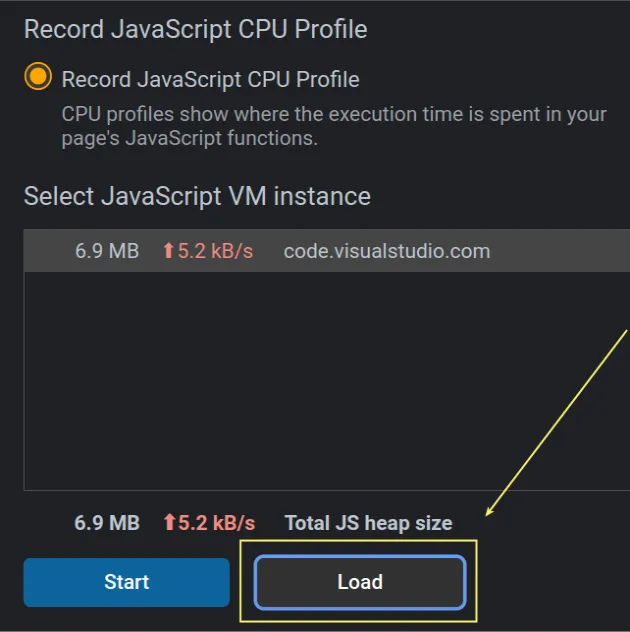
- Click on the Load button to load the CPU profile file you previously generated in VS Code.
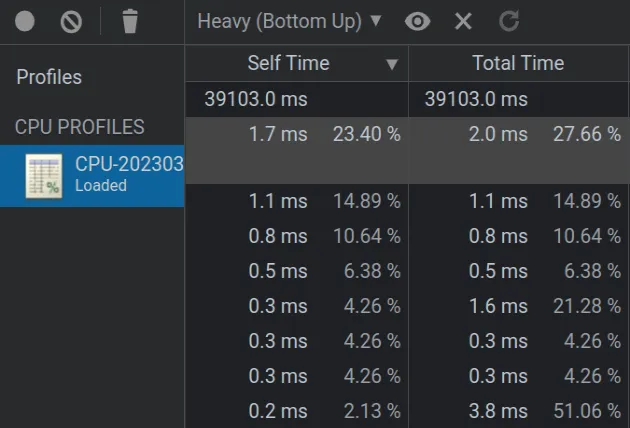
- Click on the loaded CPU profile under CPU PROFILES.
# Viewing the Startup timers
You can also check the startup performance of VS Code, e.g. how much time extensions take to load.
- Press:
Ctrl+Shift+Pon Windows and Linux.Command+Shift+Pon macOS.
F1 to open the Command Palette.- Type Startup Performance and select the option.

# Try clearing the cache and restarting your PC
If the issue persists, try clearing the VS Code cache.
If nothing else helped, try to restart your PC.
You might have VS Code or other processes running in the background or stale settings that have not been applied properly.
# Additional Resources
You can learn more about the related topics by checking out the following tutorials:

