Removing the Top and Right axis (spines) in Matplotlib
Last updated: Apr 12, 2024
Reading time·4 min

# Table of Contents
- Removing the Top and Right axis (spines) in Matplotlib
- Removing the Top and Right axis (spines) in Matplotlib using dot notation
- Removing the Top and Right axis (spines) in Matplotlib globally
- Hiding the spines with set_frame_on()
- Hiding the ticks or the labels
- Hide the top and right spines using Seaborn
# Removing the Top and Right axis (spines) in Matplotlib
To remove the top and right axis (spines) in Matplotlib:
- Use the
matplotlib.spinesproperty to get access to the top and right lines that connect the axis tick marks. - Use the
set_visible()method to remove the top and right axis (spines).
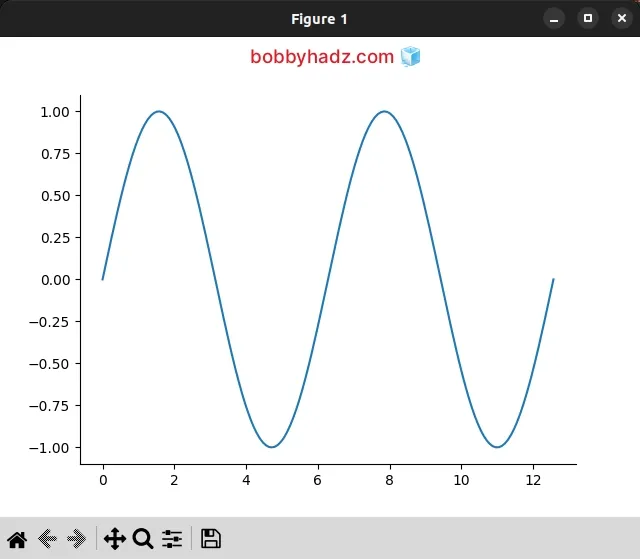
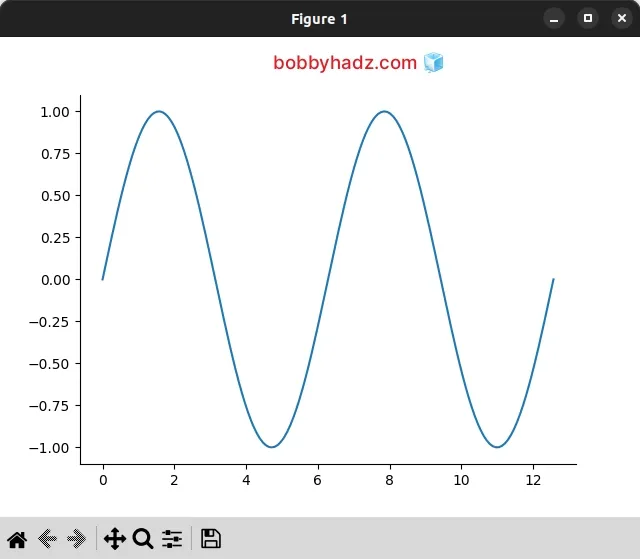
import numpy as np import matplotlib.pyplot as plt x = np.linspace(0, 4*np.pi, 150) y = np.sin(x) ax = plt.subplot(111) ax.plot(x, y) # 👇️ remove the top and right axis ax.spines[['right', 'top']].set_visible(False) plt.show()
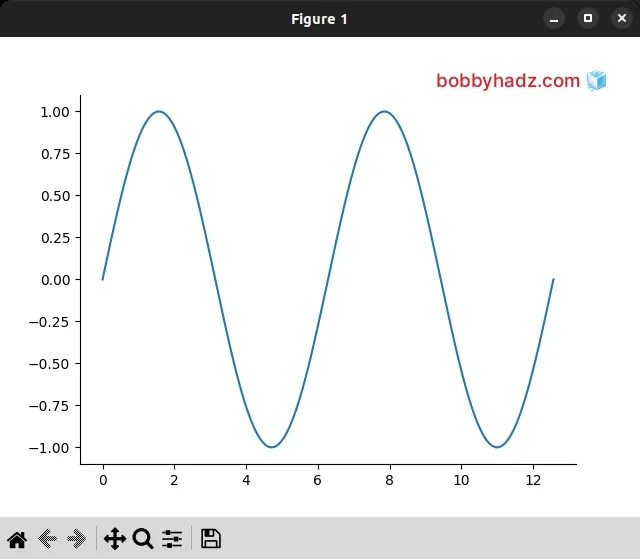
We used the spines property
to access the right and top spines.
The spines are the lines that connect the axis tick marks.
In order to access multiple spines at the same time, pass a list to the spines
attribute.
# 👇️ remove the top and right axis ax.spines[['right', 'top']].set_visible(False)
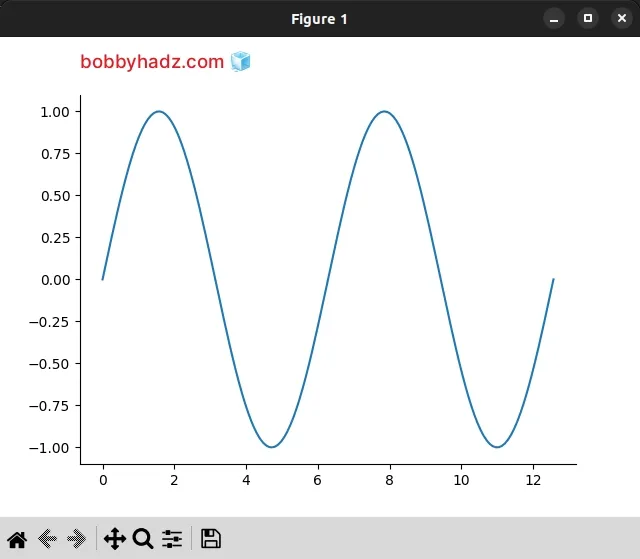
You can also use this approach to remove the left and bottom spines.
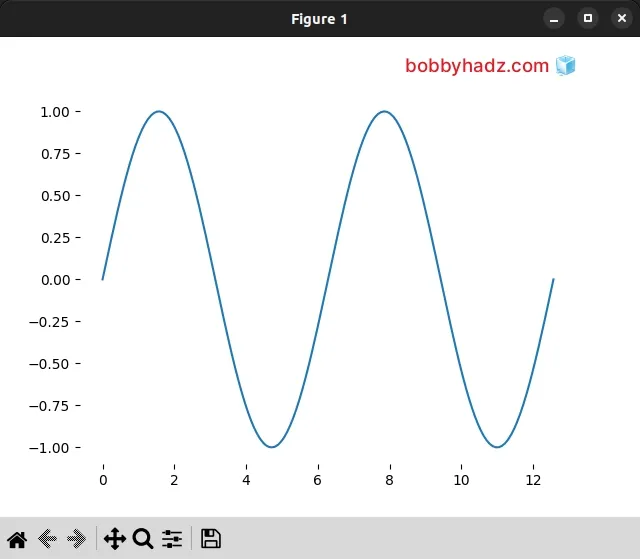
import numpy as np import matplotlib.pyplot as plt x = np.linspace(0, 4*np.pi, 150) y = np.sin(x) ax = plt.subplot(111) ax.plot(x, y) # 👇️ remove right, top, left and bottom spines ax.spines[['right', 'top', 'left', 'bottom']].set_visible(False) plt.show()
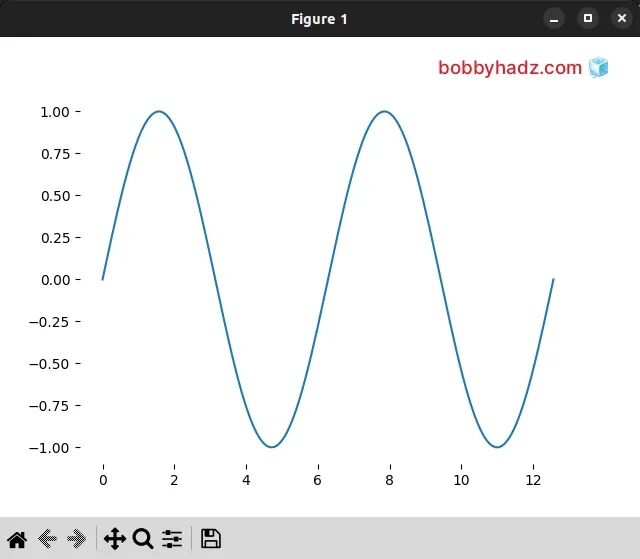
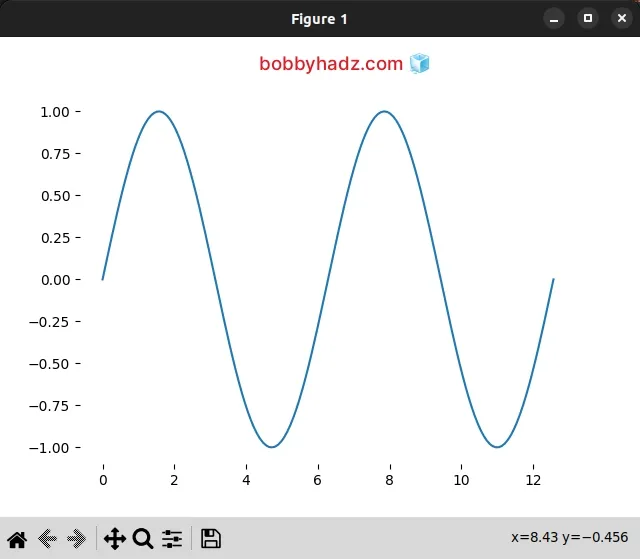
You can also use an open slice to remove all spines.
import numpy as np import matplotlib.pyplot as plt x = np.linspace(0, 4*np.pi, 150) y = np.sin(x) ax = plt.subplot(111) ax.plot(x, y) # 👇️ remove the top and right axis ax.spines[:].set_visible(False) plt.show()
# Removing the Top and Right axis (spines) in Matplotlib using dot notation
You can also use dot notation to access the top and right spines and remove
them by calling set_visible().
import numpy as np import matplotlib.pyplot as plt x = np.linspace(0, 4*np.pi, 150) y = np.sin(x) ax = plt.subplot(111) ax.plot(x, y) # 👇️ remove the top spine ax.spines.top.set_visible(False) # 👇️ remove the right spine ax.spines.right.set_visible(False) plt.show()
Notice that w used dot notation when accessing the top and right spines and
not bracket notation.
set_visible() method with a value of False removes the spines from the plot.You can also achieve the same result by using bracket notation to access each spine individually.
import numpy as np import matplotlib.pyplot as plt x = np.linspace(0, 4*np.pi, 150) y = np.sin(x) ax = plt.subplot(111) ax.plot(x, y) # 👇️ remove the top spine ax.spines['top'].set_visible(False) # 👇️ remove the right spine ax.spines['right'].set_visible(False) plt.show()
# Removing the Top and Right axis (spines) in Matplotlib globally
If you want to remove the top and right spines globally in Matplotlib, use your runtime rc settings.
import numpy as np import matplotlib.pyplot as plt plt.rcParams['axes.spines.right'] = False plt.rcParams['axes.spines.top'] = False x = np.linspace(0, 4*np.pi, 150) y = np.sin(x) ax = plt.subplot(111) ax.plot(x, y) plt.show()
The code sample sets rcParams (runtime configuration parameters) at runtime to
remove the top and right spines.
Setting rcParams at runtime takes precedence over style sheets.
All runtime configuration settings are stored in a dictionary-like variable
called matplotlib.rcParams.
The same approach can also be used to remove the left and bottom spines
globally.
import numpy as np import matplotlib.pyplot as plt plt.rcParams['axes.spines.right'] = False plt.rcParams['axes.spines.top'] = False plt.rcParams['axes.spines.left'] = False plt.rcParams['axes.spines.bottom'] = False x = np.linspace(0, 4*np.pi, 150) y = np.sin(x) ax = plt.subplot(111) ax.plot(x, y) plt.show()
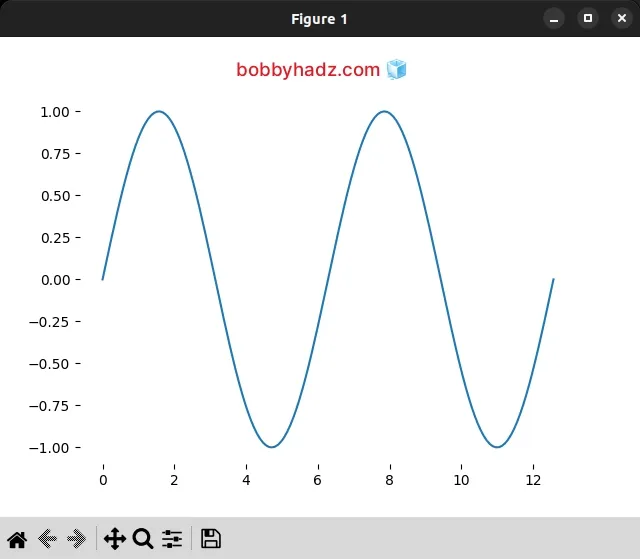
# Hiding the spines with set_frame_on()
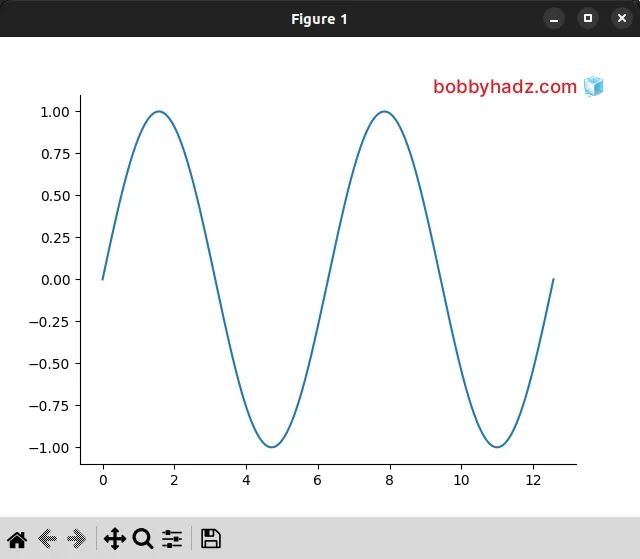
You can also use the axes.set_frame_on() method to hide the axes rectangle.
import numpy as np import matplotlib.pyplot as plt x = np.linspace(0, 4*np.pi, 150) y = np.sin(x) ax = plt.subplot(111) ax.plot(x, y) ax.set_frame_on(False) plt.show()
# Hiding the ticks or the labels
If you need to hide the ticks or the labels, use the following 2 lines.
# hide ticks ax.tick_params(top=False) # hide labels ax.tick_params(labeltop=False)
# Hide the top and right spines using Seaborn
If you use the seaborn module, you can also use the seaborn.despine() method
to hide the top and right spines.
First, make sure you
have the seaborn module installed.
pip install seaborn pip3 install seaborn
Now, import and use the module as follows.
import numpy as np import matplotlib.pyplot as plt import seaborn as sns x = np.linspace(0, 4*np.pi, 150) y = np.sin(x) ax = plt.subplot(111) ax.plot(x, y) sns.despine() plt.show()
By default, the seaborn.despine() method removes the top and right spines.
You can also pass specific keyword arguments when calling despine().
Here is an equivalent example that explicitly sets the top, right, left
and bottom keyword arguments when calling despine.
import numpy as np import matplotlib.pyplot as plt import seaborn as sns x = np.linspace(0, 4*np.pi, 150) y = np.sin(x) ax = plt.subplot(111) ax.plot(x, y) sns.despine(top=True, right=True, left=False, bottom=False) plt.show()
The example removes the top and right spines but does not remove the left
and bottom spines because the arguments are set to False.
# Additional Resources
You can learn more about the related topics by checking out the following tutorials:
- ValueError: zero-dimensional arrays cannot be concatenated
- ValueError: all the input array dimensions for the concatenation axis must match exactly
- ValueError: cannot reshape array of size X into shape Y
- lbfgs failed to converge (status=1): STOP: TOTAL NO. of ITERATIONS REACHED LIMIT
- TypeError: Image data cannot be converted to float [Solved]
- How to clear the Terminal and Console in PyCharm
- Matplotlib: No artists with labels found to put in legend
- Sklearn ValueError: Unknown label type: 'continuous' [Fixed]
- Matplotlib: How to add an Average Line to a Plot