Paused in debugger in Chrome issue [Solved]
Last updated: Apr 5, 2024
Reading time·3 min
# Table of Contents
- Paused in debugger in Chrome issue [Solved]
- Make sure you haven't enabled the "Pause on exceptions" feature
- Restoring the defaults and reloading the page
- Make sure none of the checkboxes in the left menu are checked
- Disable the paused state overlay in Chrome
- Issue the "Do not pause on exceptions" command
# Paused in debugger in Chrome issue [Solved]

To resolve the "Paused in debugger" issue in Chrome:
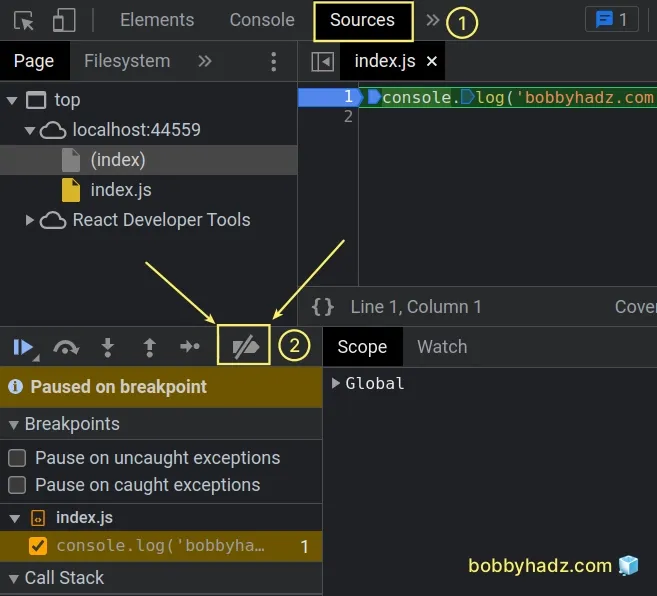
Open your developer tools by right-clicking on the page and selecting Inspect or by simply pressing
F12.Click on the Sources tab.
Click on the Deactivate breakpoints button or press
Ctrl+F8.
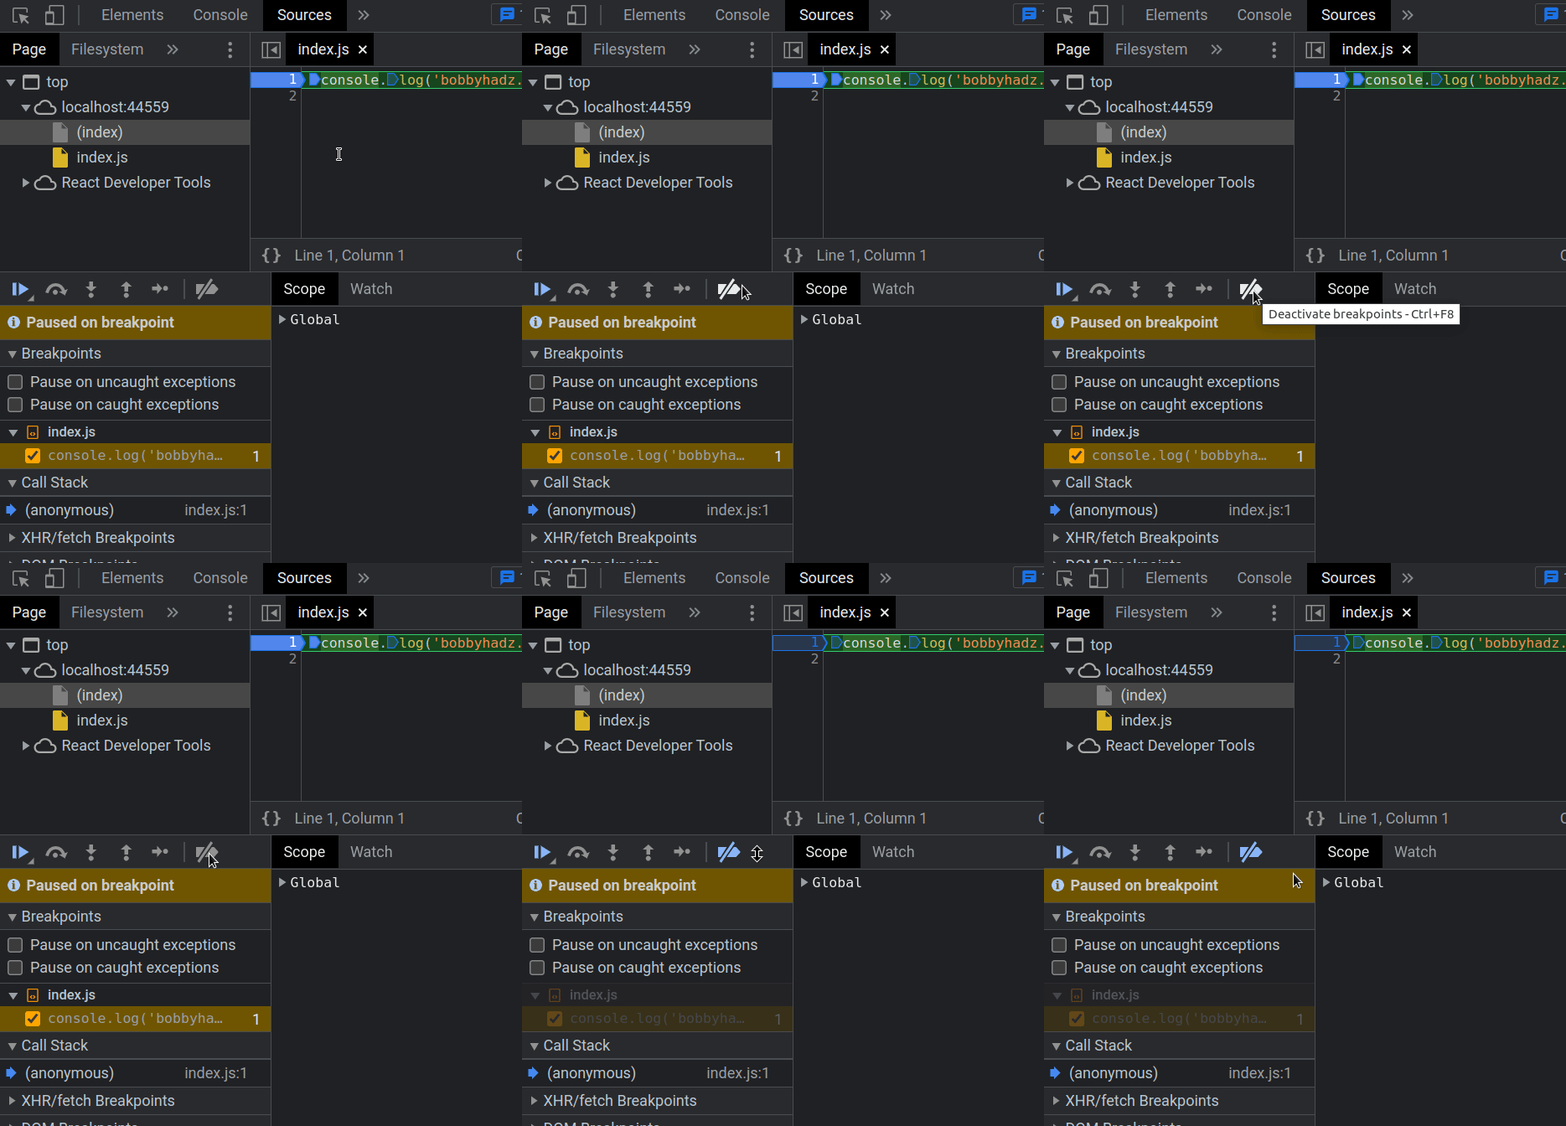
Here is a short clip that shows where the Deactivate breakpoints button is.
- Refresh the page by clicking on the Reload this page button at the top
left corner or by pressing
F5.

If the issue persists even after refreshing the page.
Open your developer tools.
Click on the Sources tab.
Click on the Deactivate breakpoints button or press
Ctrl+F8.

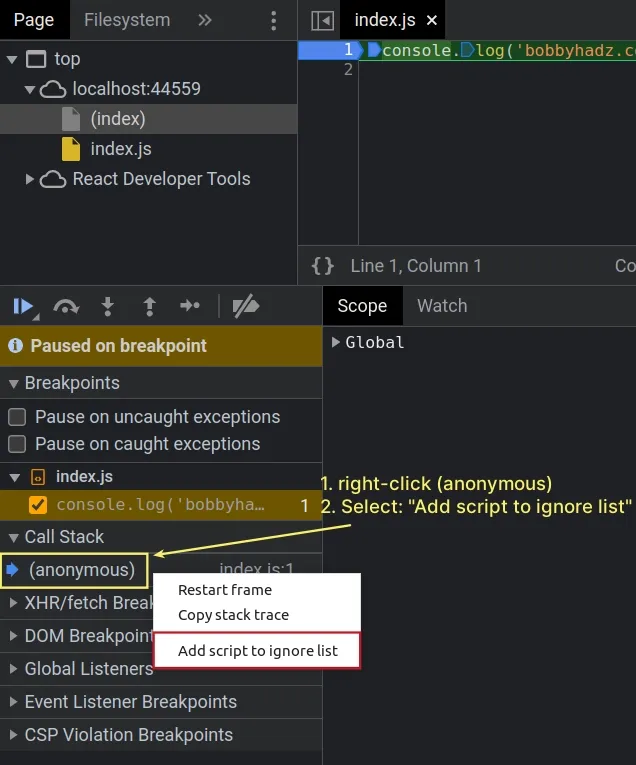
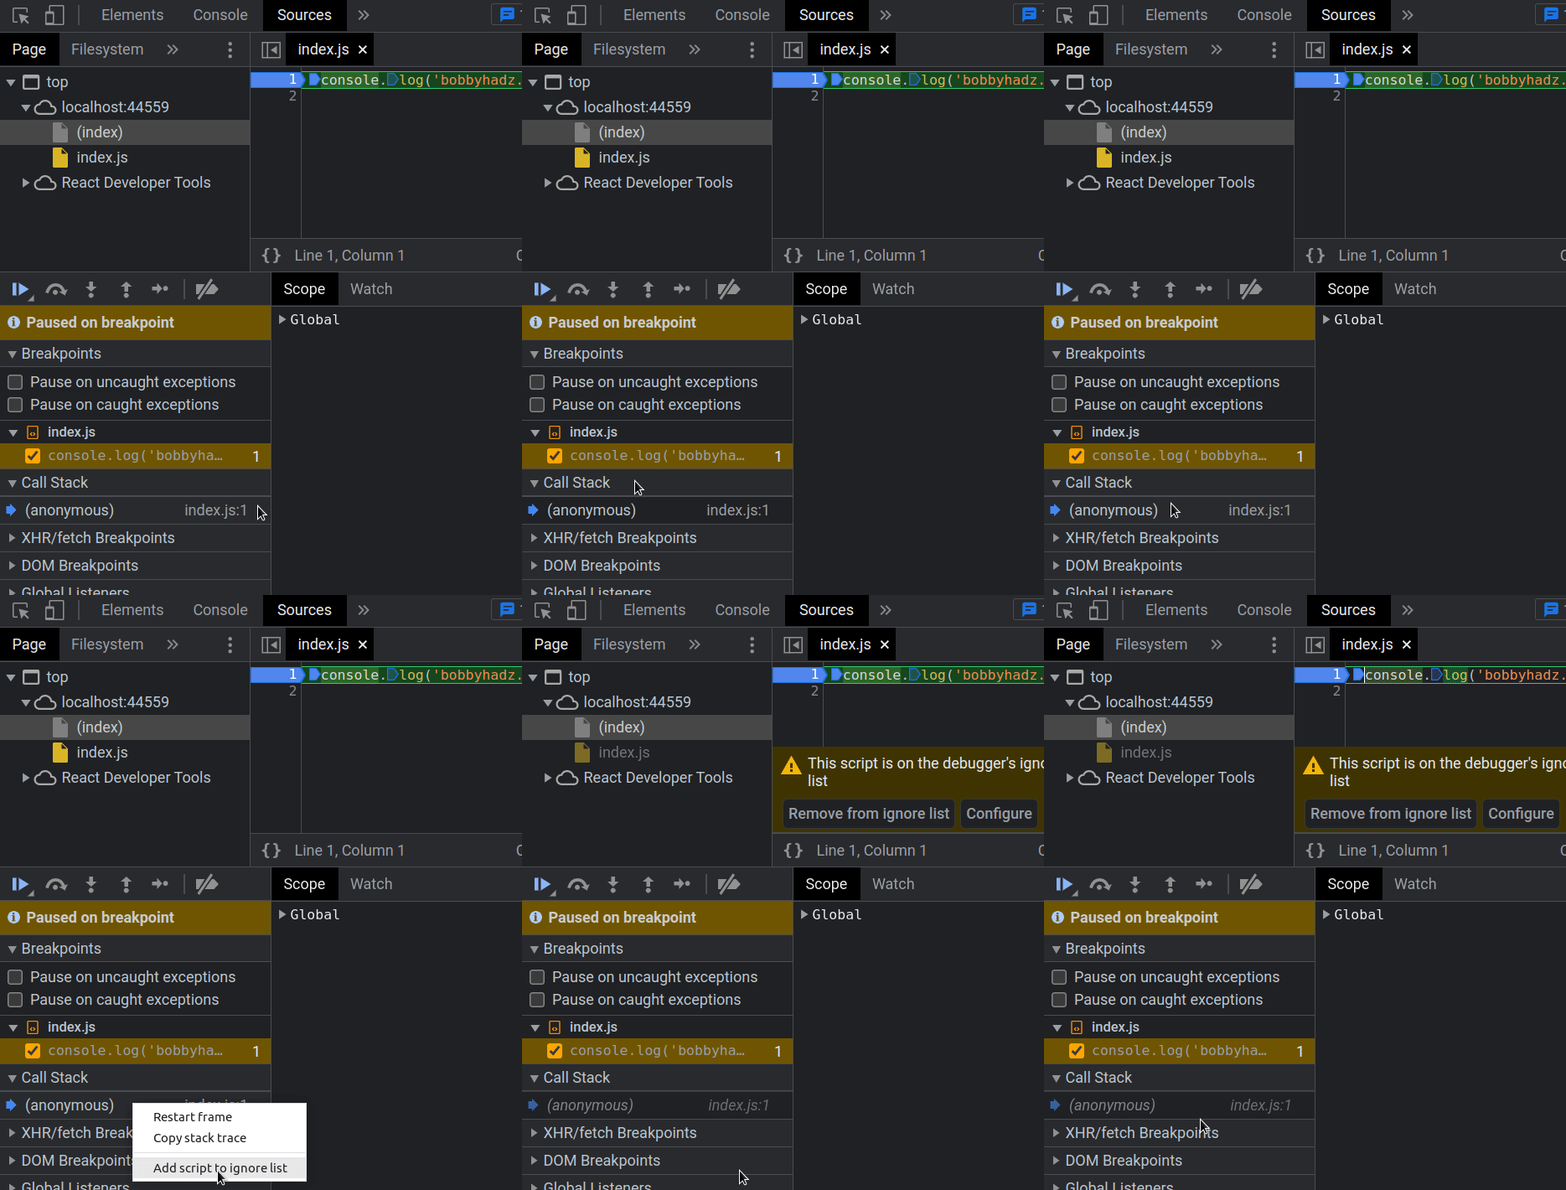
- In the menu on the left look for a Call Stack dropdown menu and expand it.
- Under Call Stack, right-click on (anonymous) and select Add script to ignore list.
- Refresh the page by clicking on the Reload this page button at the top
left corner or by pressing
F5.

Here is a short clip that demonstrates how this works.
# Make sure you haven't enabled the "Pause on exceptions" feature
If the issue persists, make sure you haven't enabled the "Pause on exceptions" feature in Chrome:
If the issue persists even after refreshing the page.
Open your developer tools.
Click on the Sources tab.
In the menu on the left under Breakpoints, make sure the following two checkboxes are NOT checked:
- "Pause on uncaught exceptions"
- "Pause on caught exceptions"
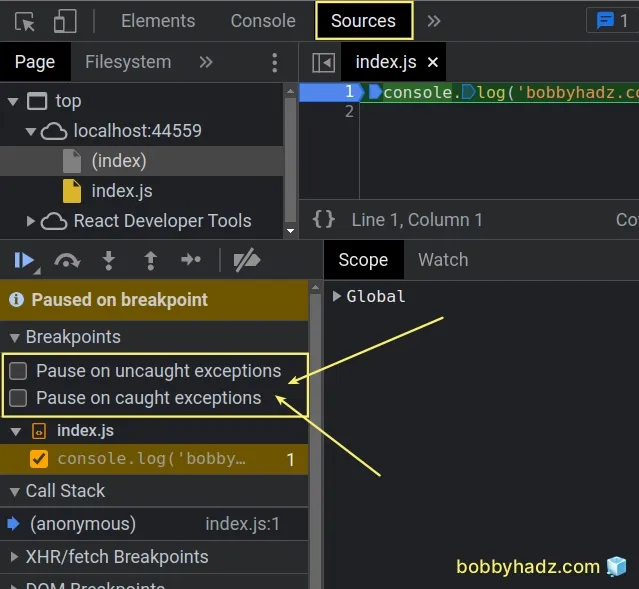
- Once you uncheck the two checkboxes, refresh the page.

If the issue persists, make sure you don't have any checkboxes checked under XHR/fetch Breakpoints in the left menu.
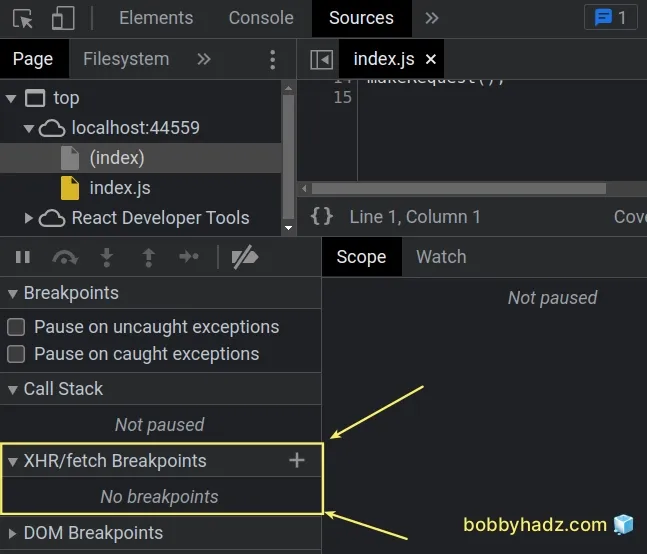
If you see an "Any XHR" checkbox under "XHR/fetch Breakpoints", make sure it is unchecked.
# Restoring the defaults and reloading the page
If none of the suggestions helped:
- Click on the Cogwheel icon in the top right corner or press
F1+Shift+?.
![]()
- Scroll down until you see the Restore defaults and reload button in the Preferences tab.
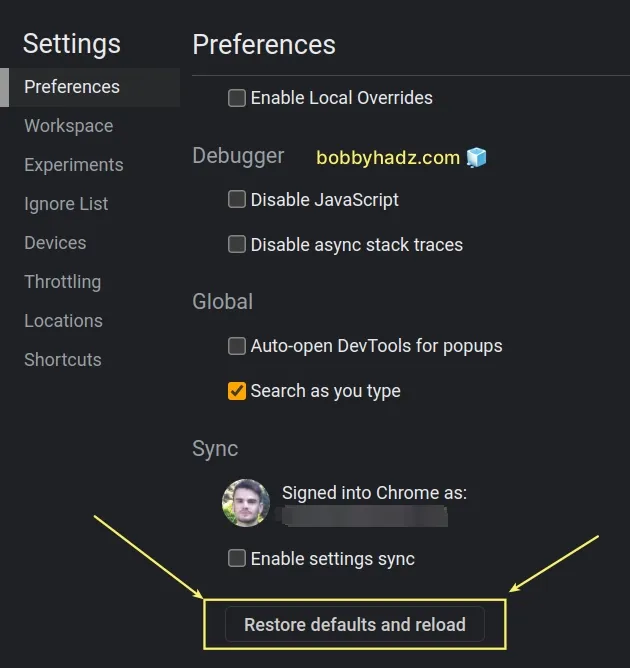
- Reload the page.
# Make sure none of the checkboxes in the left menu are checked
If the issue persists:
Open your developer tools.
Click on the Sources tab.
Expand each dropdown menu in the left sidebar and make sure that none of the checkboxes are checked.
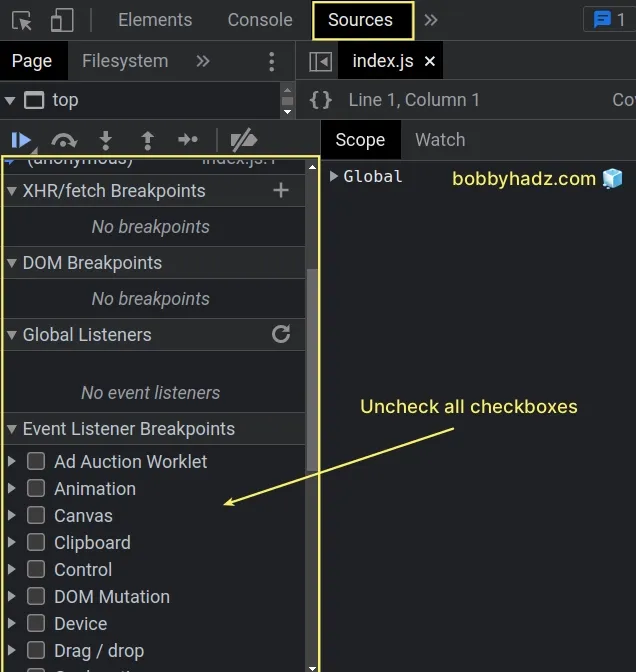
- Refresh the page.

# Disable the paused state overlay in Chrome
If the issue persists, disable the paused state overlay.
- Click on the Cogwheel icon in the top right corner or press
F1+Shift+?.
![]()
- In the Preferences tab, click on Disable paused state overlay.
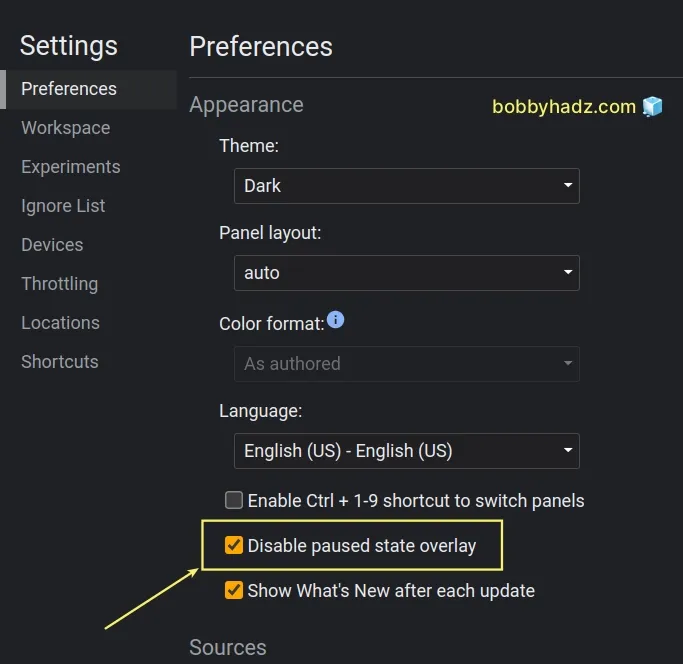
- Once you check the "Disable paused state overlay" checkbox, refresh the page.

# Issue the "Do not pause on exceptions" command
If the issue persists:
Open your developer tools by right-clicking on the page and selecting Inspect or by simply pressing
F12.Press
Ctrl+Shift+P(orCmd+Shift+P) on macOS.Type "Do not pause on exceptions" and select the command.
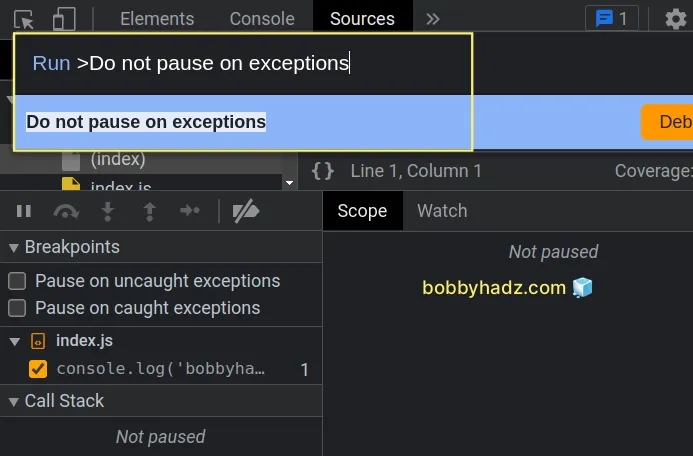
- Refresh the page.

# Additional Resources
You can learn more about the related topics by checking out the following tutorials:
- Edit and replay XHR (HTTP) requests in Chrome & Firefox
- How to clear all Cookies or a specific Cookie in Postman
- Chrome: How to Copy an Object or Array from the Console tab
- Failed to set up Chromium! Set "PUPPETEER_SKIP_DOWNLOAD"
- Unchecked runtime lastError The message port closed before a response was received
- Unable to preventDefault inside passive event listener due to target being treated as passive
- DOMException: Blocked a frame with origin from accessing a cross-origin frame
- Provisional headers are shown Chrome warning [Solved]
- How to detect AdBlockers using JavaScript [Simple Examples]

