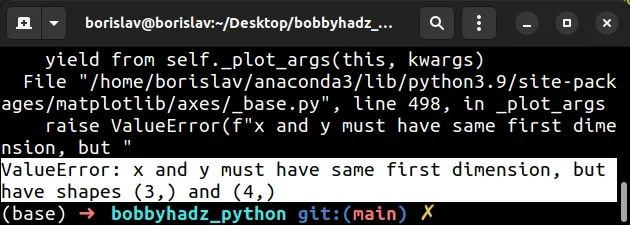
ValueError: x and y must have same first dimension, but have shapes
Last updated: Apr 10, 2024
Reading time·3 min

# ValueError: x and y must have same first dimension, but have shapes
The error "ValueError: x and y must have same first dimension, but have
shapes" occurs when the values you pass to the pyplot.plot() method have
different dimensions.
To solve the error, make sure the x and y values you pass to pyplot.plot()
have the same length.
import matplotlib.pyplot as plt x = [1, 2, 3] y = [1, 2, 3, 4] # ⛔️ ValueError: x and y must have same first dimension, but have shapes (3,) and (4,) plt.plot(x, y, '-', color='green') plt.show() plt.close()
The first two arguments the
pyplot.plot()
method takes are the x and y values.
The length of the x and y values must be the same.
The error is caused because the x value has a length of 3 and the y value
has a length of 4.
The part of the error message "but have shapes (3,) and (4,)" tells us that one of the lists has a length of 3 and the other one has a length of 4.
One way to solve the error is to add a value to the x list so that the length
of x and y matches.
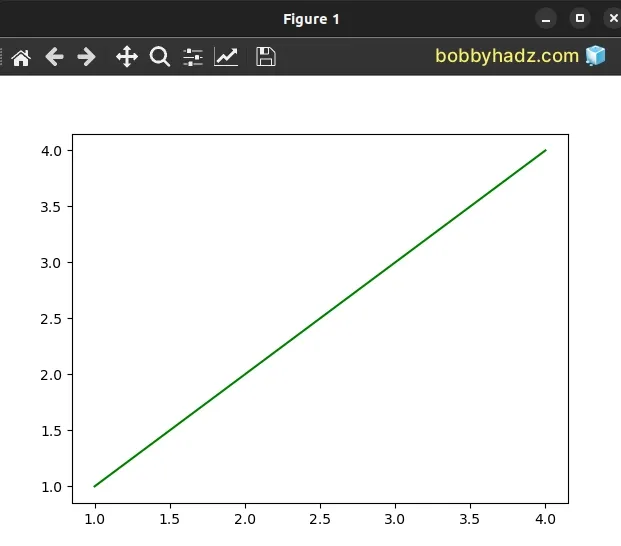
import matplotlib.pyplot as plt # 👇️ both have a length of 4 x = [1, 2, 3, 4] y = [1, 2, 3, 4] plt.plot(x, y, '-', color='green') plt.show() plt.close()
You can use the len() function if you need to get the length of a list.
x = [1, 2, 3, 4] y = [1, 2, 3, 4] print(len(x)) # 👉️ 4 print(len(y)) # 👉️ 4
Both lists in the example have a length of 4, so they can safely be used as the
x and y values when calling plot().
Alternatively, you can remove a value from the y, list so that both x and
y have a length of 3.
import matplotlib.pyplot as plt x = [1, 2, 3] y = [1, 2, 3] plt.plot(x, y, '-', color='green') plt.show() plt.close()
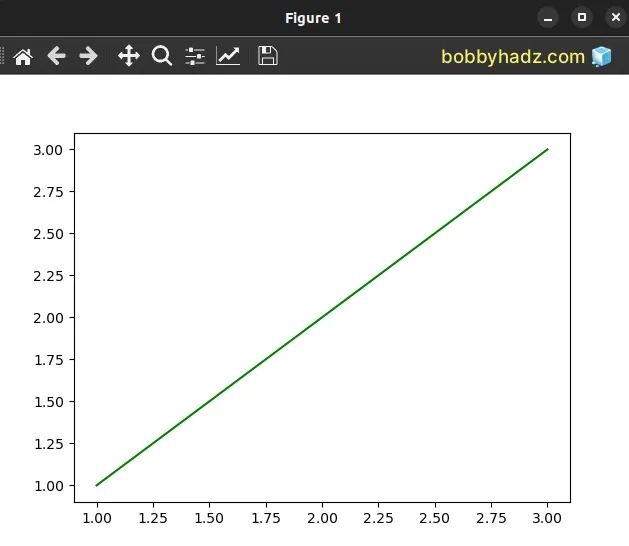
Both lists in the example have a length of 3, so everything works as expected.
x = [1, 2, 3] y = [1, 2, 3] print(len(x)) # 👉️ 3 print(len(y)) # 👉️ 3
If x or y is a 2D array, a separate data set is drawn for each column.
import matplotlib.pyplot as plt x = [1, 2, 3] y = [[1, 2], [3, 4], [5, 6]] plt.plot(x, y, '-', color='green') plt.show() plt.close()
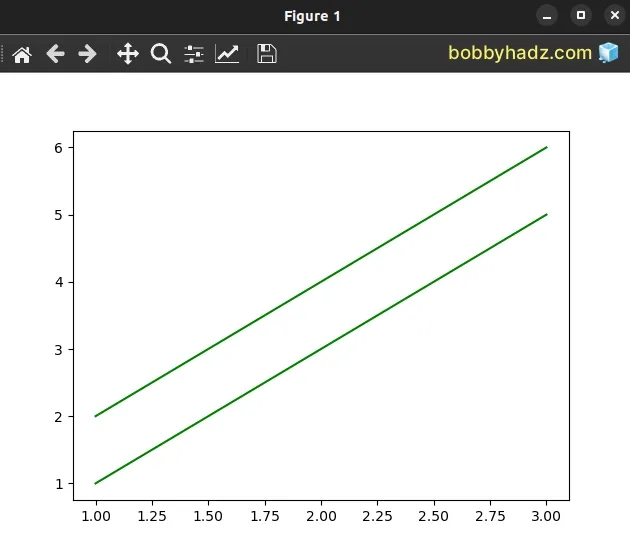
Notice that the lengths of the 1D and 2D arrays are the same - they both have 3 elements.
x = [1, 2, 3] y = [[1, 2], [3, 4], [5, 6]] print(len(x)) # 👉️ 3 print(len(y)) # 👉️ 3 print(len(y[0])) # 👉️ 2
I've written a detailed article on how to get the length of a 2D array.
If both x and y are 2D arrays, they must have the same shape.
In some cases, you might be generating x or y based on the output of a
custom function.
import numpy as np import matplotlib.pyplot as plt def plot(func): x = np.linspace(2.0, 4.0, num=5) y = func(x) # 👇️ [2., 2.5, 3., 3.5, 4.], length is 5 print(x, len(x)) # 👇️ [ 4., 6.25, 9., 12.25, 16.], length is 5 print(y, len(y)) plt.plot(x, y, '-', color='green') plt.show() plt.close() plot(lambda x: x ** 2)
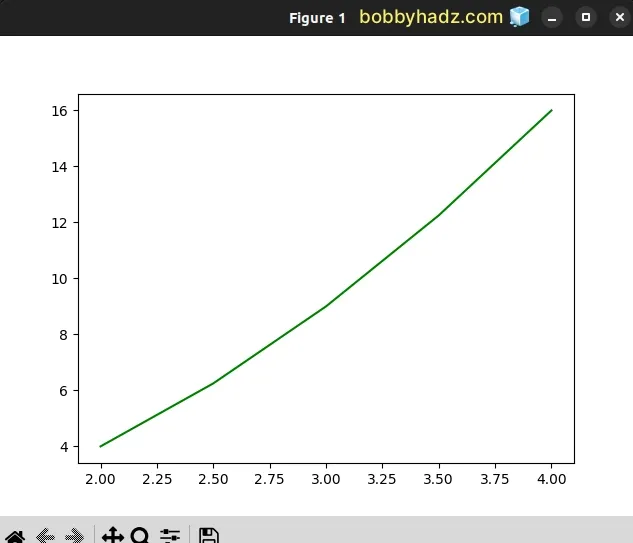
We used the
numpy.linspace()
method to get evenly spaced numbers over a given interval and then assigned the
result to the x variable.
We then calculated the y variable with a custom lambda function that takes
each value in a sequence and squares it.
Notice that both x and y have a length of 5, so plotting the two lists is
allowed.
# Additional Resources
You can learn more about the related topics by checking out the following tutorials:
- ModuleNotFoundError: No module named 'matplotlib' in Python
- ValueError: numpy.ndarray size changed, may indicate binary incompatibility
- Convert a NumPy array to 0 or 1 based on threshold in Python
- How to get the length of a 2D Array in Python
- TypeError: 'numpy.ndarray' object is not callable in Python
- TypeError: Object of type ndarray is not JSON serializable
- IndexError: too many indices for array in Python [Solved]
- How to filter a JSON array in Python