Matplotlib is currently using agg, which is non-GUI backend
Last updated: Apr 13, 2024
Reading time·3 min

# Matplotlib is currently using agg, which is non-GUI backend
The Python "UserWarning: Matplotlib is currently using agg, which is a non-GUI
backend, so cannot show the figure." occurs when you try to display a plot
with your Matplotlib backend set to a non-GUI backend, such as Agg.
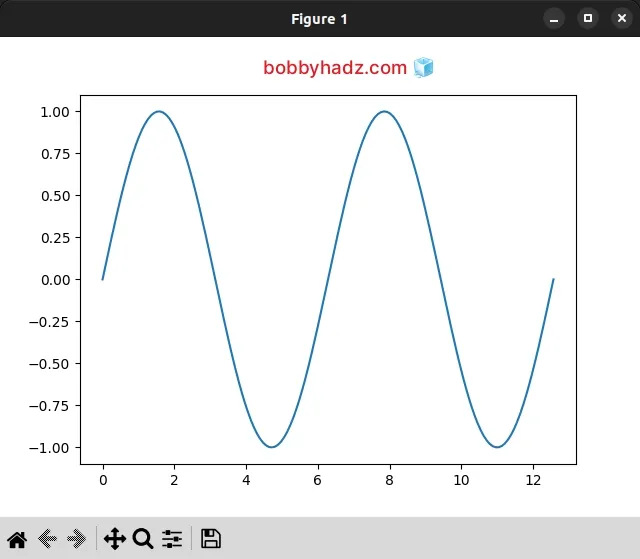
The first thing you should try is to set the backend to TkAgg.
import matplotlib matplotlib.use('TkAgg') import numpy as np import matplotlib.pyplot as plt x = np.linspace(0, 4*np.pi, 150) y = np.sin(x) ax = plt.subplot(111) ax.plot(x, y) plt.show()
Make sure to add the matplotlib.use('TkAgg') line above the line that imports
matplotlib.pyplot.
If you get the ModuleNotFoundError: No module named 'tkinter' in Python error, click on the link and follow the instructions on how to install Tkinter.
# Try using the plt.savefig() method instead
Another thing you can try is to use the
pyplot.savefig()
method instead of using pyplot.show().
import numpy as np import matplotlib.pyplot as plt x = np.linspace(0, 4*np.pi, 150) y = np.sin(x) ax = plt.subplot(111) ax.plot(x, y) plt.savefig('my-plot.png')
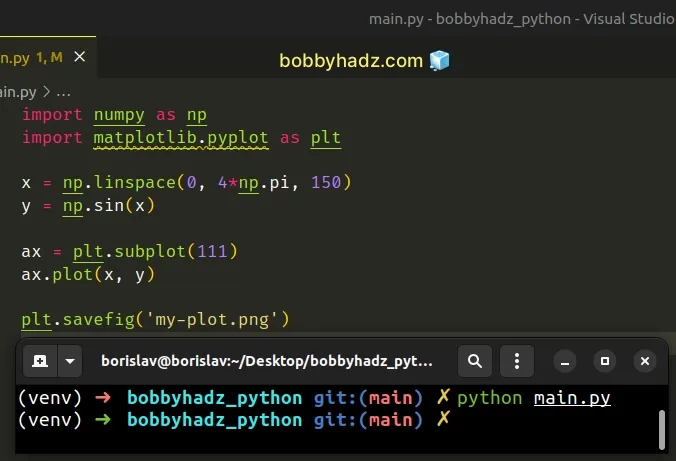
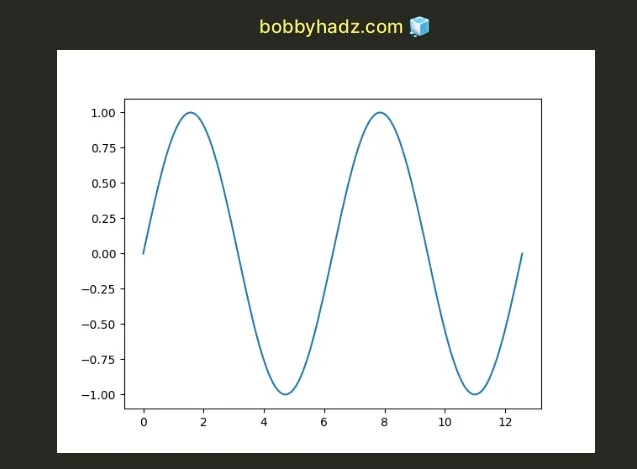
The pyplot.savefig() method saves the current plot.
I passed the name of the output image to the method.
# Try installing the PyQt5 module
Another thing that may help is installing the PyQt5 module.
pip install PyQt5 # or with pip3 pip3 install PyQt5
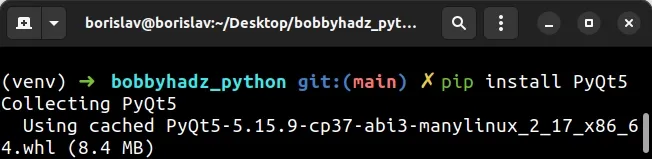
By installing the PyQt5 module, you also install Matplotlib GUI backends, which should resolve the issue.
# Use the %matplotlib inline line in Jupyter Notebook
If you get the error when using Jupyter Notebook, set the %matplotlib inline
line at the top.
%matplotlib inline import numpy as np import matplotlib.pyplot as plt x = np.linspace(0, 4*np.pi, 150) y = np.sin(x) ax = plt.subplot(111) ax.plot(x, y) plt.show()
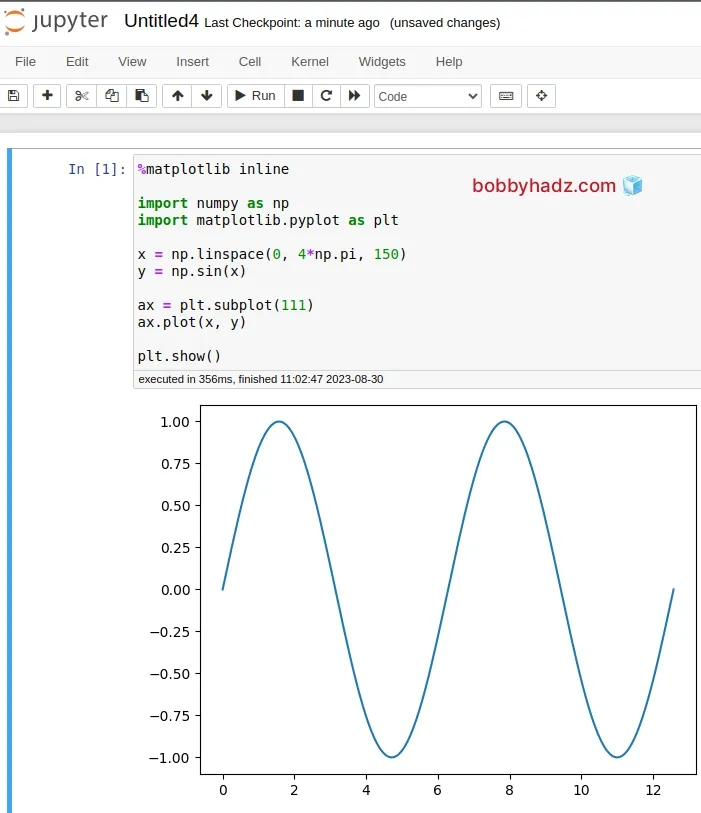
The %matplotlib inline directive is a magic function in IPython.
Its purpose is to set the backend of Matplotlib to the inline backend.
This helps us display the output of plotting commands inline within frontends like Jupyter Notebook, directly below the code cell that produced it.
I've written in detail about this magic function in my how to show a PIL Image in Jupyter Notebook article.
In Jupyter Notebook, you can also try to use the display() function to render
your plots.
from IPython.display import display import numpy as np import matplotlib.pyplot as plt x = np.linspace(0, 4*np.pi, 150) y = np.sin(x) ax = plt.subplot(111) ax.plot(x, y) display(plt)
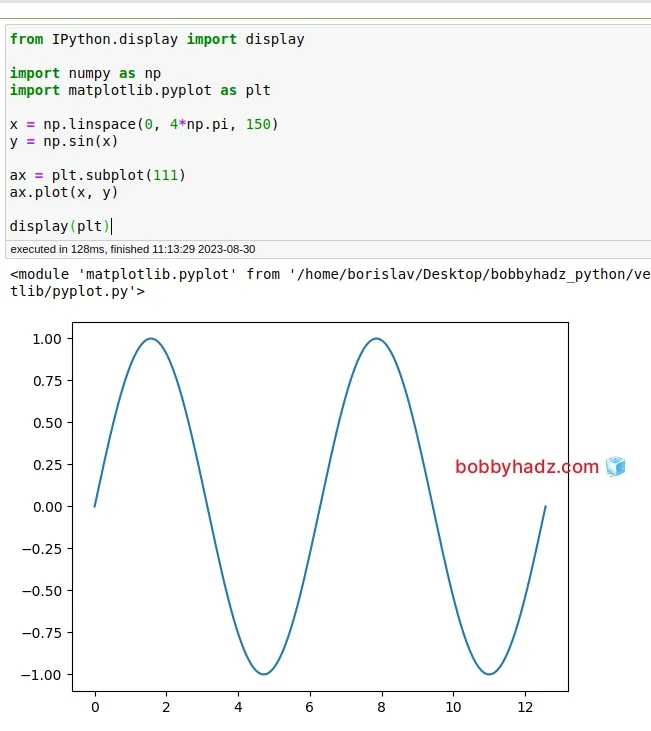
We imported and used the display function.
You can pass the plt or fig variables directly to display().
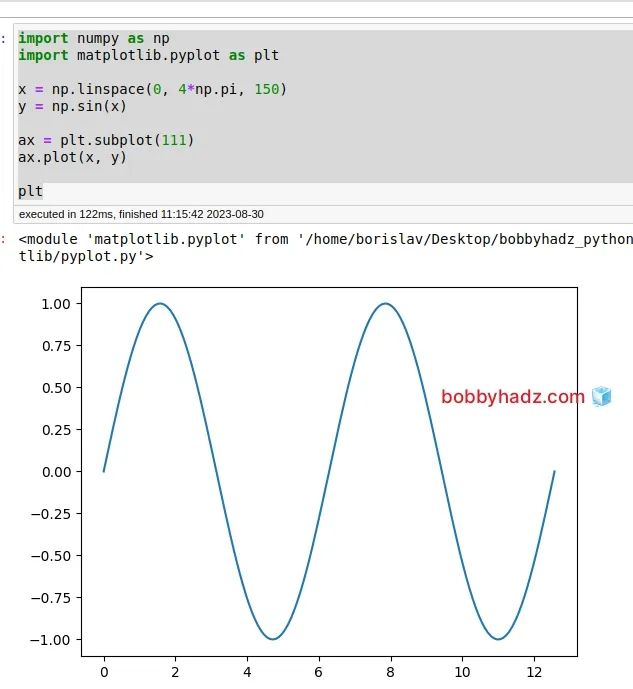
You can also try to use plt or fig as the last line of a cell, instead of
calling plt.show().
import numpy as np import matplotlib.pyplot as plt x = np.linspace(0, 4*np.pi, 150) y = np.sin(x) ax = plt.subplot(111) ax.plot(x, y) plt
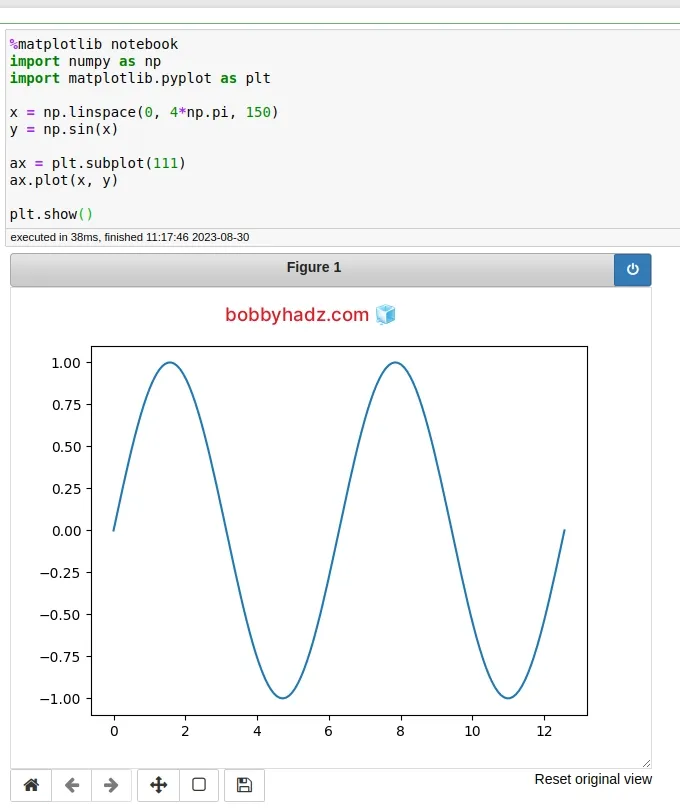
You can also try using the %matplotlib notebook magic function.
%matplotlib notebook import numpy as np import matplotlib.pyplot as plt x = np.linspace(0, 4*np.pi, 150) y = np.sin(x) ax = plt.subplot(111) ax.plot(x, y) plt.show()
# Install Tkinter on your machine
If none of the suggestions helped, follow the instructions in this article on how to install Tkinter.
Once you install Tkinter, you should be able to set the backend to TkAgg
without running into any issues.
import matplotlib matplotlib.use('TkAgg') import numpy as np import matplotlib.pyplot as plt x = np.linspace(0, 4*np.pi, 150) y = np.sin(x) ax = plt.subplot(111) ax.plot(x, y) plt.show()
You can even try to remove the line that sets the engine and try to use the default one.
import numpy as np import matplotlib.pyplot as plt x = np.linspace(0, 4*np.pi, 150) y = np.sin(x) ax = plt.subplot(111) ax.plot(x, y) plt.show()
# Additional Resources
You can learn more about the related topics by checking out the following tutorials: