Failed to load response data: Request content was evicted from inspector cache
Last updated: Apr 5, 2024
Reading time·4 min
# Failed to load response data: Request content was evicted from inspector cache
The Chrome message "Failed to load response data: Request content was evicted from inspector cache" is most commonly shown when the HTTP response contains a large file or a large JSON response.
To resolve the issue and capture the response, copy the request as cURL and
redirect the response to a text file or simply try to use a different browser.
To capture the response:
Right-click on the request in the Network tab of your Chrome developer tools.
Hover over Copy and select Copy as cURL.

Paste the
cURLcommand into a text file and add> response.txtto it to redirect the response to a text file namedresponse.txt.Open the
response.txtfile and view the HTTP response.
If you need to install cURL on Windows, check out the following article.
# Using Postman to view the response
Alternatively, you can use the Postman application to view the response.
Make sure you have the Postman application.
Right-click on the request in the Network tab of your Chrome developer tools.
Hover over Copy and select Copy as cURL.
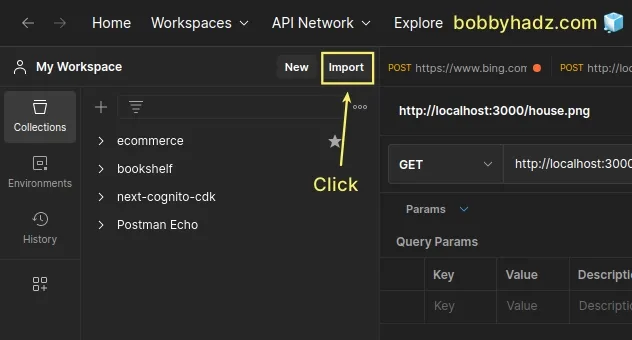
- Click on the Import button.
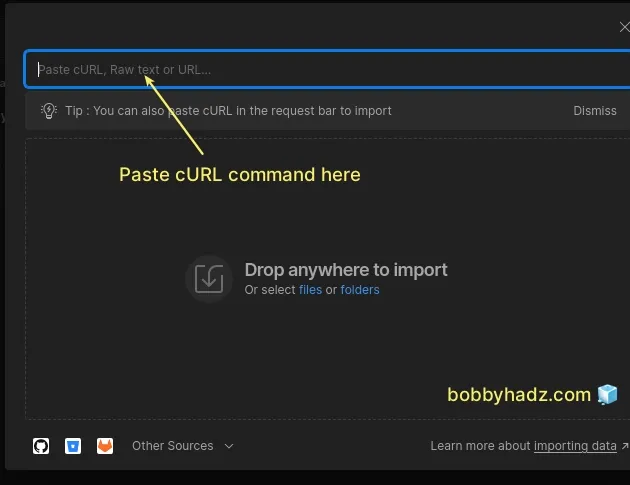
- Paste the
cURLcommand into the field.
- Click on the Send button or press
Ctrl+Enterto send the request.
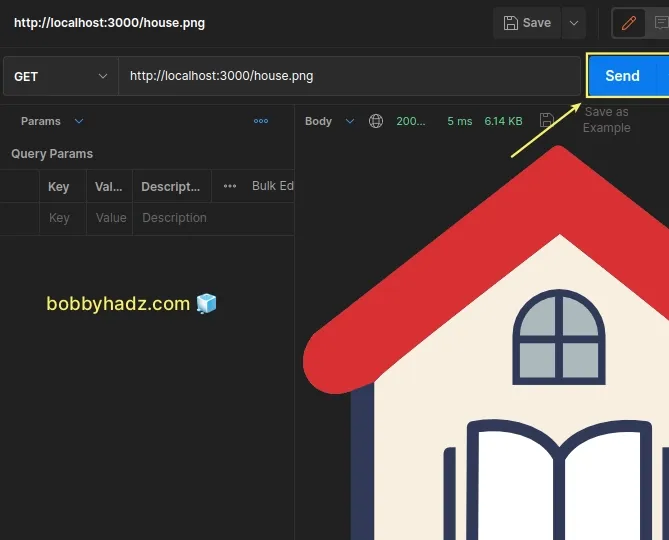
- View the Response.
# View large JSON responses in a JSON viewer online
If you encountered the issue when working with large JSON responses, you can:
- Copy the request URL and open it in a new tab.
- Copy the JSON data and paste it into a JSON viewer online to inspect it.
# Using fetch() to view the response
You can also copy the request as fetch and view the response.
Right-click on the request in the Network tab of your Chrome developer tools.
Hover over Copy and select Copy as fetch.

- Paste the copied
fetchrequest into anindex.jsfile.
It might look something like this.
fetch("http://localhost:3000/house.png", { "headers": { "accept": "*/*", "accept-language": "en-US,en;q=0.9,de;q=0.8", "sec-ch-ua": "\"Google Chrome\";v=\"113\", \"Chromium\";v=\"113\", \"Not-A.Brand\";v=\"24\"", "sec-ch-ua-mobile": "?0", "sec-ch-ua-platform": "\"Linux\"", "sec-fetch-dest": "empty", "sec-fetch-mode": "cors", "sec-fetch-site": "same-site", "sec-gpc": "1" }, "referrer": "http://localhost:43611/", "referrerPolicy": "strict-origin-when-cross-origin", "body": null, "method": "GET", "mode": "cors", "credentials": "omit" }).then(response => response.json()) .then(data => { console.log(data); });
Make sure to add the following lines after the fetch() function call.
.then(response => response.json()) .then(data => { console.log(data); });
The additional lines wait for the Promise to resolve and console.log the
response data.
The example above assumes that the response has a Content-Type of
application/json.
If your response consists of text, then add the following 3 lines instead.
.then(response => response.text()) .then(data => { console.log(data); });
If the response is a file, add the following lines after the fetch() call
instead.
.then(response => response.blob()) .then(data => { console.log(data); });
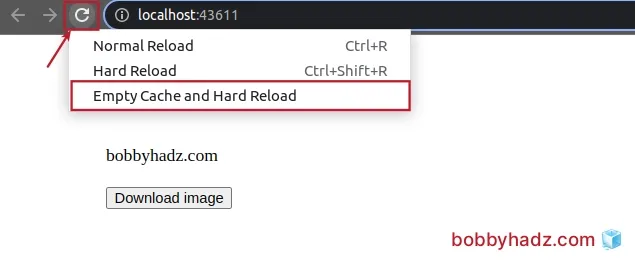
# Try to empty the cache and hard reload the page
If the issue persists, try to empty the cache and hard reload the page.
- Open your Chrome developer tools by pressing
F12. - Right-click on the Reload page button and select Empty Cache and hard reload.
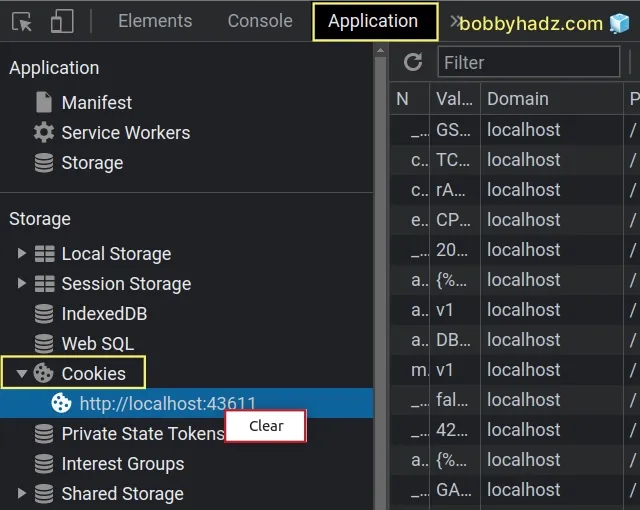
If the issue persists try to clear your Cookies for the page:
- Click on the Application tab in Chrome.
- Expand the Cookies dropdown menu under Storage.
- Right-click on the website and select Clear.
# The issue happens when you have the Preserve log checkbox checked
The issue also happens when:
- You have the Preserve log checkbox checked in your Network tab.
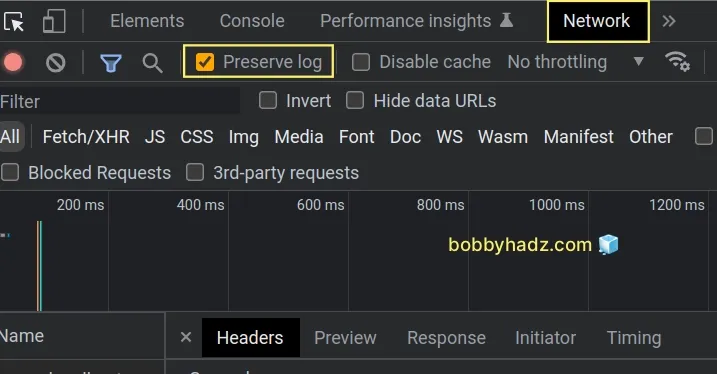
- You navigate to a different page and try to view the response.
Try to uncheck the Preserve log checkbox, reload the page and see if you can view the response data.
# Add a breakpoint to listen for the beforeunload event
If the issue persists, try to add a breakpoint to listen for the beforeunload
event:
Click on the Sources tab in your Chrome developer tools.
Click on Event listener Breakpoints dropdown, expand Load and check beforeunload.
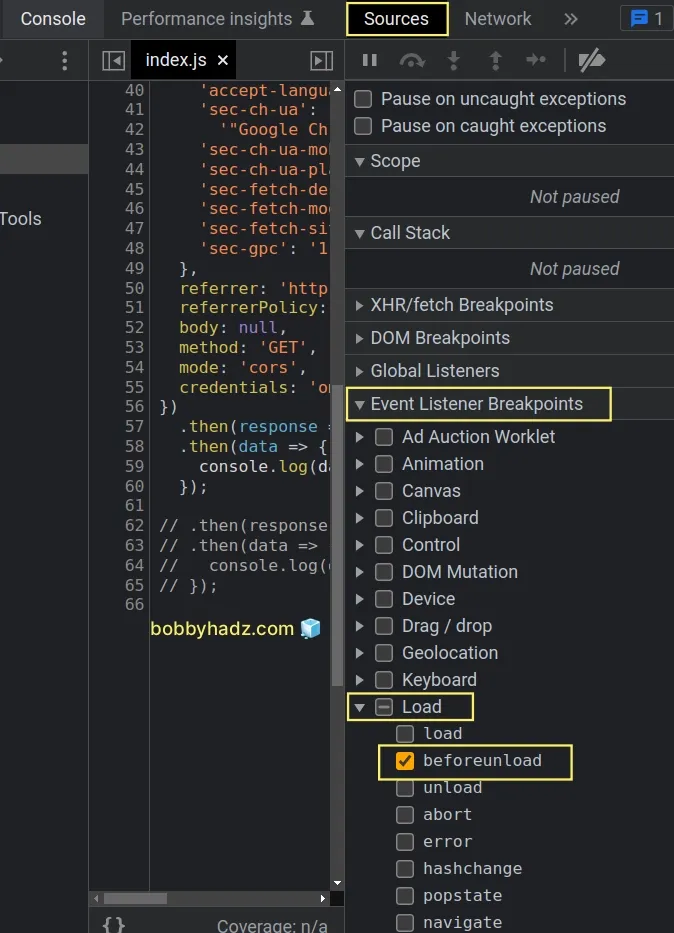
- Refresh the page and check if you can view the response in the Network tab.
You can also:
- Add the following code to your JavaScript file.
window.onunload = function() { debugger; }
- Refresh the page and check if you can view the response in the Network tab.
The unload event is triggered when the document or a child resource is being unloaded.
This helps if you are running into the "Failed to load response data: Request content was evicted from inspector cache" issue when navigating between pages.
# Try to use a different browser
If none of the suggestions helped, try to use a different browser.
The issue most commonly occurs in Chrome, so try to issue the request using Firefox, Safari or Opera.
Firefox is able to display larger responses even after navigating to another page.
I've also written a detailed guide on how to edit and replay XHR (HTTP) requests in Chrome & Firefox.
# Additional Resources
You can learn more about the related topics by checking out the following tutorials:
- How to clear all Cookies or a specific Cookie in Postman
- Chrome: How to Copy an Object or Array from the Console tab
- Failed to set up Chromium! Set "PUPPETEER_SKIP_DOWNLOAD"
- Unchecked runtime lastError The message port closed before a response was received
- Paused in debugger in Chrome issue [Solved]
- Unable to preventDefault inside passive event listener due to target being treated as passive