Crbug/1173575, non-JS module files deprecated error [Solved]
Last updated: Mar 7, 2024
Reading time·6 min
# Crbug/1173575, non-JS module files deprecated error [Solved]
The error "crbug/1173575, non-JS module files deprecated error" occurs when there are connectivity issues, most likely when debugging in Visual Studio Code.
To solve the error, make sure your network is not set to "Offline" in your browser's Network tab and ensure your development server is running.
crbug/1173575, non-JS module files deprecated. chromewebdata/(index)꞉5305:9:5551 ERR_CONNECTION_REFUSED Exception has occurred: ReferenceError: closeDescriptionPopup is not defined
# Make sure your network is not set to Offline
The first thing to check is that your network is not set to Offline in your browser's developer tools.
- Press
F12to open your developer tools or right-click on a page and click Inspect. - Click on the Network tab and make sure your network connectivity is not set to Offline or Slow 3G.
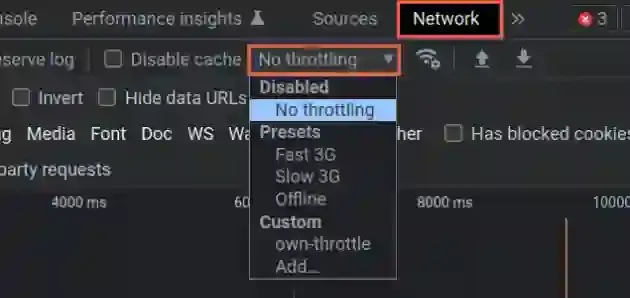
Right next to the Preserve log and Disable cache checkboxes, there is a dropdown menu from which you can select No throttling.
The most common cause of the error is connectivity issues when trying to connect to your server.
# Make sure your server is running in a separate terminal window
Make sure your server is running in a separate terminal window before you start debugging.
The debugger won't start your server automatically.
Forgetting to start your server before starting the debugger is often a cause of the error.
You have to keep the server running in the background for the debugger to be able to establish a connection.
# Make sure the URL in your launch.json file is correct
There should be a .vscode/launch.json file in your project if you are
debugging in VSCode.
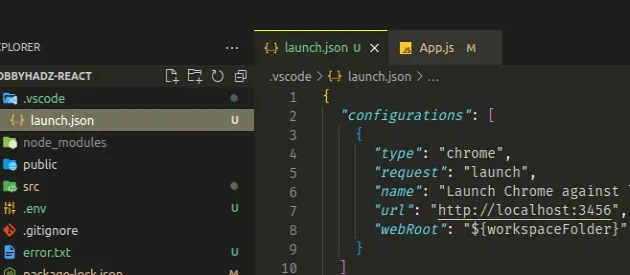
I am debugging a React.js application, so my .vscode/launch.json file looks as
follows.
{ "configurations": [ { "type": "chrome", "request": "launch", "name": "Launch Chrome against localhost", "url": "http://localhost:3456", "webRoot": "${workspaceFolder}" } ] }
The React.js application is started on http://localhost:3456.
Make sure the port and URL in your .vscode/launch.json file are correct.
You might have to manually change the port if Visual Studio Code got it wrong.
If your launch.json file points to an incorrect URL, the debugger won't be
able to establish a connection and the error is raised.
Make sure you haven't specified an incorrect protocol.
For example, you most likely shouldn't use https:// when testing on localhost.
Instead http:// should be used.
# ⛔️ incorrect protocol (https) https://localhost:3456 # ✅ correct protocol (http) http://localhost:3456
# Replacing http://localhost:3000 with http://127.0.0.1:3000
If you are testing on localhost, try to replace http://localhost:3000 with
http://127.0.0.1:3000 (adjusting your port).
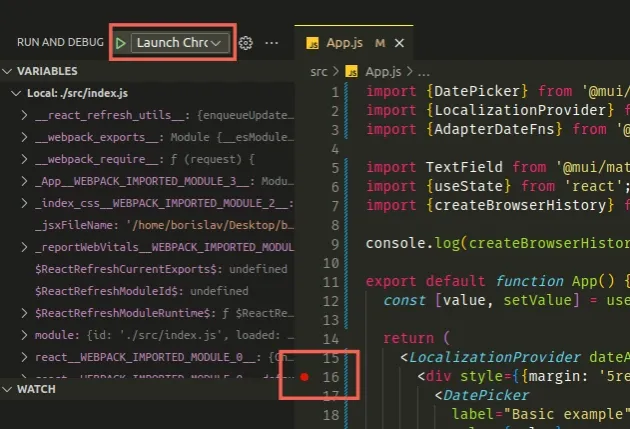
Set a breakpoint on a line in your code and try to Launch the Chrome debugger.
Try to close and reopen your browser and look in the console for any additional errors.
# Make sure the port you have started your server on is not taken
Make sure the port you have started your server on is not taken by a different application.
This would cause connectivity issues and the "crbug/1173575, non-JS module files deprecated error".
Make sure that a firewall is not preventing you from reaching the specific website.
If you use React.js or Angular, check out the following articles:
- Change the default Port for a create-react-app project
- How to change the default Port number (4200) in Angular
# If a launch.json file got automatically created, try to delete it
If a .vscode/launch.json file got automatically created, try to delete it and
check if the error is resolved.
If you need to have a launch.json file, recreate it and make sure the url
property points to the correct domain and port.
# Make sure your NPM packages are installed
Open your terminal in your project's root directory (where your package.json)
file is located and then run the npm install command.
npm install
If the error is not resolved, try to delete your node_modules and
package-lock.json (not
package.json) files, re-run npm install and restart your IDE.
# 👇️ (macOS/Linux) delete node_modules and package-lock.json rm -rf node_modules rm -f package-lock.json # 👇️ (Windows) delete node_modules and package-lock.json rd /s /q "node_modules" del package-lock.json # 👇️ clean npm cache npm cache clean --force # 👇️ install packages npm install
# Try to restart your IDE and your Browser
If the error persists, try to restart your IDE and development server.
Visual Studio Code often glitches and needs a reboot.
Restarting your browser might also help.
Another thing that might help is clearing your browser's cache and cookies.
# Example of debugging a JavaScript project in Visual Studio Code
Here are some examples of how to debug different types of projects in Visual Studio Code.
To debug a JavaScript project in Visual Studio Code:
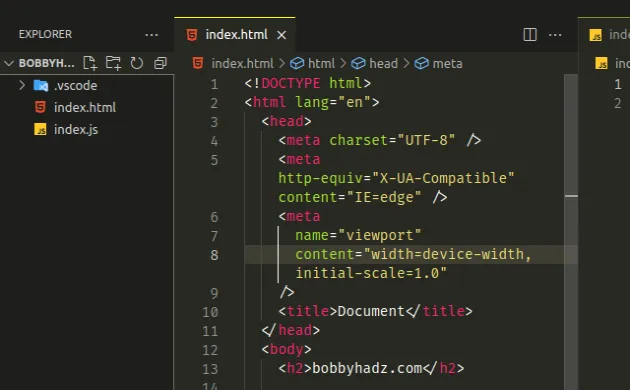
- Create an
index.htmlfile with the following contents.
<!DOCTYPE html> <html lang="en"> <head> <meta charset="UTF-8" /> <meta http-equiv="X-UA-Compatible" content="IE=edge" /> <meta name="viewport" content="width=device-width, initial-scale=1.0" /> <title>Document</title> </head> <body> <h2>bobbyhadz.com</h2> <script src="index.js"></script> </body> </html>
- Create an
index.jsfile in the same directory, adding the following code to it.
console.log('hello world');
- Install the live-server package and start it.
npm install -g live-server
You can start the live-server package with the following command.
live-server
The web page should open in your browser, e.g. at http://127.0.0.1:8080/.
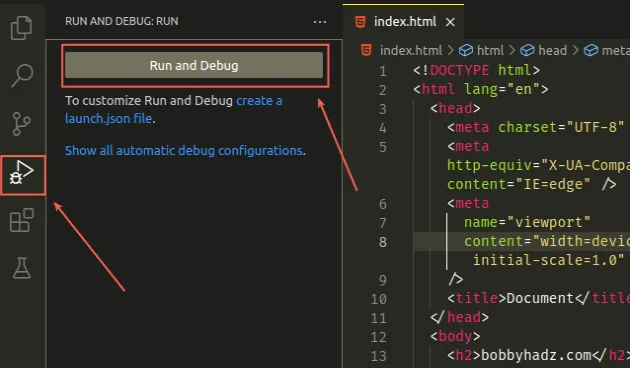
- Click on the "Run and Debug" icon in the left sidebar and then click on "Run and Debug" again.
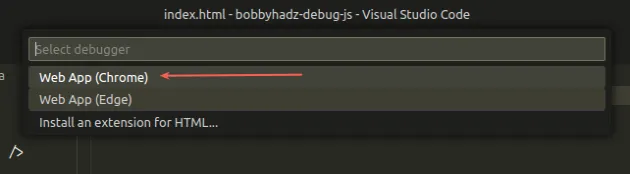
- In the menu, click on "Web App (Chrome)".
This will create a
.vscodefolder in the root directory of your project.There is a
launch.jsonfile in the.vscodefolder in which the settings are stored.
Your launch.json file should look similar to the following.
{ // Use IntelliSense to learn about possible attributes. // Hover to view descriptions of existing attributes. // For more information, visit: https://go.microsoft.com/fwlink/?linkid=830387 "version": "0.2.0", "configurations": [ { "name": "Launch Chrome", "request": "launch", "type": "chrome", "url": "http://localhost:8080", "webRoot": "${workspaceFolder}" } ] }
Make note of the url and make sure your live-server application is running
on the same port.
The code sample above assumes that live-server is running on
"http://localhost:8080".
The url property in your launch.json configuration should match the URL your
live-server is running on (including the port).
An "Add configuration" button appears when you open your launch.json file
in Visual Studio Code.
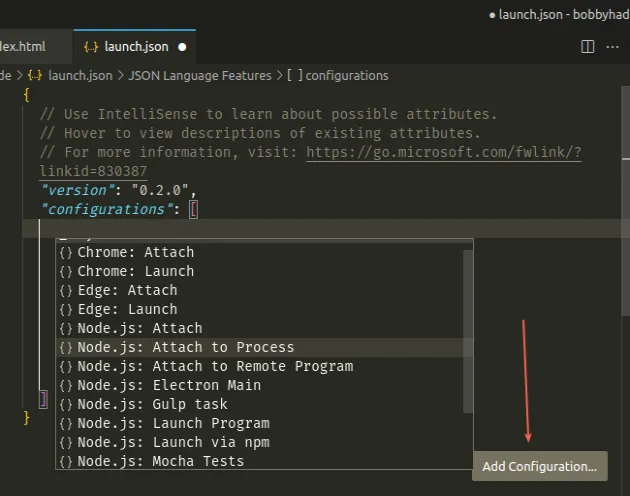
You can click on the button to test different configuration settings depending on the type of the application you are debugging.
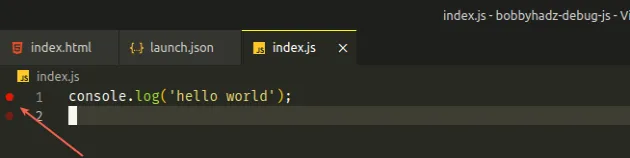
- Set a breakpoint on a line in your
index.jsfile.
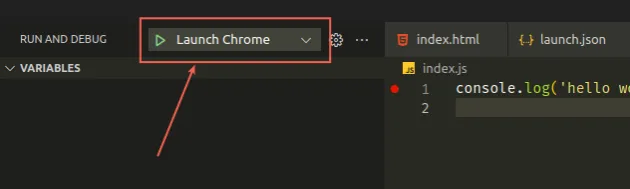
- Click on "Launch Chrome" under Run and Debug.
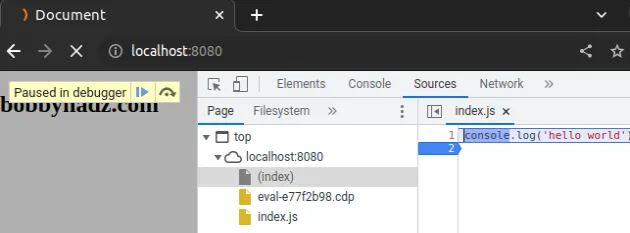
A browser will open, in which you can open the developer tools by pressing
F12.If you set a breakpoint, the code will be paused in the debugger.
# Watching a quick video on how to debug code in Visual Studio
If the error persists, I would suggest watching a quick video on how to debug code in Visual Studio Code.
The following video has instructions on how to debug JavaScript, React and Angular applications in Visual Studio Code.
# Conclusion
To solve the "crbug/1173575, non-JS module files deprecated error", make sure:
- Your network is not set to Offline in your browser's Network tab.
- Your development server is running in a separate terminal window before starting your debugger.
- The
urlproperty in your.vscode/launch.jsonfile points to the correct domain and port. - You don't have a firewall or any other connectivity issues that would prevent you from accessing the website.
- You have tried restarting your IDE and development server.